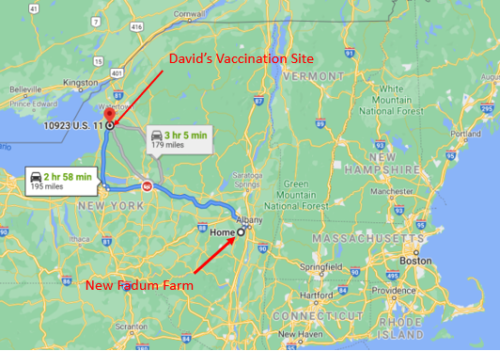
Deborah and David were saddened to learn that Nancy had been diagnosed with a very serious cancer. For over forty years, before Nancy and her husband Matt moved to North Carolina, Nancy had been one of Deborah’s best friends. They were both members of the “Squeaky Wheels,” a small group of women who met on Thursday nights in each other’s living rooms to knit, spin wool, and share stories. Nancy helped Deborah get her first milking goat and wool sheep. Matt introduced David to the joys of keeping pastures mowed and taking in the hay on hot summer days. Surely, we had to make a road trip to North Carolina to see and hug Nancy sooner rather than later. We hadn’t seen them at all during the pandemic.
David immediately began to gather data in order to run some “mental simulations” to assess the size of the risks that they might face on such a trip. They would be staying in hotels for seven nights and taking many of their meals indoors, especially while on the road. If conditions were the same as those in reported data about Albany where Deborah and David live or in Pinehurst, NC where Matt and Nancy live, the risks would be low. David even used the online MicroCovid calculator to assess the cumulative exposure risks from such a trip. But there was a major unknown factor: since they would be traveling along major north-to-south interstate highways, these overnights and meals would put them in contact with an unforeseeable mix of persons from across the country. And, ominously, the media were reporting on the rapid spread of the highly infectious Delta variant of the virus.
David knew that in Ali’s simulation model, the COVID-19 pandemic is driven to a very low equilibrium level by a vaccination program in which the vaccine is 90% effective and 70% of the population is willing to be vaccinated. He also knew that in “what if” simulations of the model, the pandemic was able to make a strong comeback under certain conditions, notably when the fraction willing to be vaccinated was lower than 70%, or when the effectiveness of the vaccine dropped low enough. David judged that these hypothetical “what if” runs of Ali’s were worthy of concern because he and Deborah would be traveling through states where the vaccination rates were lower than in New York and, more worrisome, the emerging Delta variant was known to be more contagious and was believed to be more able to infect even fully vaccinated persons.
David knew from his own experiences of decades of working with formal simulation models of complex systems that “mental model simulations” can’t reliably substitute for more formal analyses. That said, here is how his reasoning worked. Measured data in Albany, NY and Pinehurst, NC indicated that travel would be safe assuming somewhat similar risk levels at points along the trip. The MicroCovid online calculator indicated that the cumulative risk would remain within a prudent risk budget for a one-week period. Most importantly, even if the combination of the emerging Delta variant and a relatively low vaccination rate among travelers on the road was indeed leading to a new outbreak, the outbreak would take several weeks at least to get going, and Deborah and David would be back home by then.
Deborah and David set out on the trip. They stayed masked and socially distant whenever indoors. They noted with some concern that only about 10% of the other travelers they saw were making a similar decision.
It was a great trip—sad but very rewarding to spend time with oldest and best friends. On the return drive, Deborah heard on the news that the CDC was once again recommending that people wear masks and keep socially distanced while indoors.
This Story Has a Lesson
In simulations of Ali’s model, a vaccine that is 90% effective and reaches 70% of the population does a good job of containing the pandemic, holding infections to a low, steady equilibrium level. However, the pandemic is still latent within this complex system. If the fraction willing to be vaccinated drops low enough, or if the vaccine effectiveness were to be lower, or if the base level of infectivity is somewhat higher, or some combination of these three factors occurs, the pandemic might erupt again. This pandemic is still with us, and it is still worthwhile to be careful and take precautions.
Read More to Dig Deeper
When David returned from North Carolina, he posed several questions to Ali and Dan on the modeling team to test out his “mental simulations”. In Ali’s model, can the pandemic break out again due to the introduction of the highly infectious Delta variant? Specifically, what combinations of infectivity, vaccine effectiveness, and fraction of the population willing to vaccinated can lead to the breakout?
Here are some quick answers to these questions. Yes, in Ali’s model it is possible for the pandemic to re-emerge, and when it re-emerges, it returns to a mode of repeating surges like those seen was before the vaccination program was put in place. Figure 2 below illustrates how this happens.
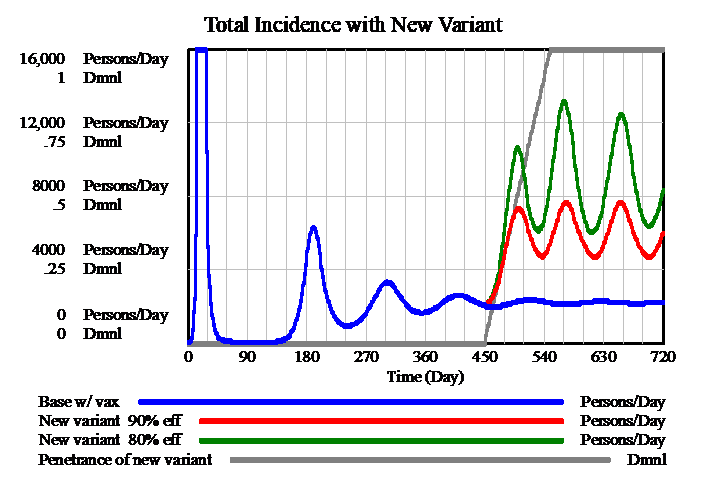
The possible effects of a new Delta-like variant were simulated by doubling the infectivity of the virus in the model; in other words the likelihood of the virus passing from an infected to an uninfected person through social contact is doubled. The new variant is introduced at day 450, and by day 550 it completely replaces the original virus, as shown by the grey line.
The figure shows the results of three simulations. The blue line shows the base run of the model (90% effective vaccine and 70% of the population willing to be vaccinated). In this run, the vaccine program controls the pandemic.
The red line shows a re-emergence of the repeated surging mode of behavior when infectivity increases due to the new variant. The green line simulates the same system, except in this case the vaccine is only 80% effective against the new virus (as opposed to 90% as in the blue and red lines). While this newly emerging version of the pandemic mostly involves the unvaccinated population, there is cross-infection impacting the fully vaccinated population: the vaccinated are in contact with more infected persons and they are somewhat less protected by the vaccine the¥ received.
We shouldn’t take these results as precise predictions or forecasts, of course. They pertain only to the simulated world that exists virtually within the model. Nonetheless, they can help inform us as we decide how to live our lives in these tricky times.
