
COVID-19 Policy Simulator and Learning Environment
Public Outreach Division
Department of Disease Control (DCD)
Ali Mashayekhi, Emeritus Sharif University of Technology
Dan Gordon, Retired
NYS Department of Health
David Andersen, Emeritus
University at Albany-SUNY
Luis Luna-Reyes
University at Albany-SUNY
Part 2: Exploring Disease Dynamics with no Human Countermeasures
Pandemics are amazingly complicated events. Disease spreads in often unpredictable ways over all forms of global geography and across all political, cultural, and social lines. Dynamics are dramatically influenced by the climate and the time of the year. Individuals demonstrate marked individual differences in how susceptible they are to infection and how likely it is that they will become hospitalized or even die if infected.
Back in March of 2020, even before the first wave of infection had peaked in the United States, Ali Mashayekhi, a prominent system dynamicist living in Tehran built the first version of the simulation contained in this work. Built to inform policy making for the nation of Iran, Ali’s model stripped away all of the complications mentioned above and proposed that the whole population could be thought of as four mathematically uniform groups: (1) Susceptible persons who had not yet been exposed to the virus, (2) Exposed persons who had been exposed and were incubating the disease, (3) Infected persons who were fully stricken and might be in the hospital and might even die, and (4) Recovered persons who had come out of the other side of the disease. This formulation was based on decades of rigorous research and calibration of the so-called SEIR models used by epidemiologists all over the world.
Ali knew that how we as a “human herd” reacted to infections, hospitalizations, and even deaths would dramatically shape the path of the pandemic. He postulated that hospitals would become overwhelmed increasing the lethal impact of the virus. His theory included the fact that as deaths surged among the population, everyone would become more cautious decreasing rates of daily contact between susceptible and infected persons as well as the probability of transmitting the disease between infected and susceptible persons. Conversely, Ali theorized that the human “herd” would return to a base level of less caution as the death rate subsides. Ali’s model did an uncannily good job of predicting as early as March of 2020, before the first surge had even peaked, that surges would repeat for several years. His model contained a complete causal theory of why repeating surges might be the long run pattern.
In the absence of human countermeasures surges do not repeat very much. Before taking a closer look at why and how the pandemic comes in repeating surges, we step back to look at a simpler view of the pandemic. The classic SEIR model of infection without complicated human reactions and countermeasures typically depicts an infection that runs through a population with a single large surge that turns around when herd immunity has been reached. Herd immunity occurs when the pool of susceptible persons has been so depleted that an average sick person does not have enough contact with susceptible persons to infect even one more person (to replace him in the infected pool), so the stock of infected persons starts to decline. (Earlier, we wrote a story that explained some of the algebra associated with the turning point and decline in infected persons. You can find that story here.
In simple SEIR models, surely within Ali’s model without any human countermeasures present, nature’s own way of ending a pandemic is very harsh. No one can say for sure how bad it might be, but some simple arithmetic can help visualize the scale of the problem. If herd immunity is achieved when more than 70% of the population immune (after recovering from infection) and if the death rate for infected persons were to stay at 2.4%, the originally measured death rate for persons infected with COVID before treatments were developed, then we could make the following estimate. In the United States with a population of roughly 330 million persons, herd immunity would be achieved when 330 million * 0.7 = 231 million persons had been infected. Without advanced treatments or other countermeasures, the total number of deaths would be 231 million persons infected X 2.4 % death rate = 5.54 million deaths1 . Nature has a very harsh way of ending a pandemic.
Ali’s theory of pandemic has three key parameters. Like many other SEIR models, Ali’s model has three key parameters that define the shape of a pandemic in the absence of human countermeasures:
- Infectivity is the likelihood of viral transmission between an infected person and a susceptible one when the two come into contact. In the base run, we assume this probability is 4%.
- Contacts is the average number of daily contacts between an infected person (who is not in quarantine) and other susceptible persons. Ali assumes this number is 15 contacts per day.
- Death Rate is the fraction of infected persons who will eventually die from COVID-19. Ali assumes that this fraction is 2.4%, an estimate from relatively early in the pandemic. Especially with the new Omicron variants, the base rate for deaths has decreased quite a bit. In addition, some public policies—notably vaccinations—dramatically decrease observed deaths in Ali’s model. Deaths are very important to Ali’s theory of the COVID-19 pandemic because population behavior responds to the relative death rate.
Start by Making Three Runs.
- Base Run (set to mimic original COVID-19 virus). When you open the simulator and click on the “Dashboard” view, the simulator should open to the Base Run.
- Delta-like Variant. The Delta Variant that appeared in the late summer of 2022 was very similar to the original virus except it was twice as infective. Simulate the Delta Variant by changing Infectivity (the Probability of transmission given contact between an infected and susceptible person) from 4% to 10%.
- Rural Population. The virus spreads differently in rural areas than in crowded urban settings. To simulate a more rural area, change Contacts (average number of daily interpersonal contacts for each person in the population) from 15 to 7. National and state-level statistics regularly blend urban and rural rates of transmission. Ali’s model has a uniform population without rural vs. urban distinctions.
Self-Test Questions for Part 2: Exploring Disease Dynamics with no Human Countermeasures
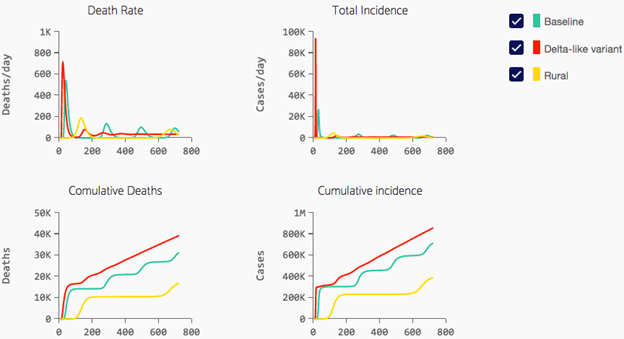
Q1: In all the runs shown above, the pandemic starts with a very dramatic initial explosion in Death Rate and Total Incidence (all persons infected at any point in time). Why does this occur?
Q2: What causes the turnaround at the first peak and the subsequent steep decline?
Q3: In the Baseline Run, there appears to be a “rebound surge” about 250 days out. Why is that?
Q4: What is the difference between Total Incidence and Cumulative Incidence?
Q5: If the Delta variant is more than twice as infective, why are cumulative deaths for the Delta variant and the Base Run so similar?
Q6: Why is the cumulative deaths in a rural area so much less?
