
COVID-19 Policy Simulator and Learning Environment
Public Outreach Division
Department of Disease Control (DCD)
Ali Mashayekhi, Emeritus Sharif University of Technology
Dan Gordon, Retired
NYS Department of Health
David Andersen, Emeritus
University at Albany-SUNY
Luis Luna-Reyes
University at Albany-SUNY
Part 3: Understanding Behavioral Countermeasures of the Whole Population
Nature’s method for controlling a pandemic has devastating consequences for the human population. No one know for sure how bad it would get, but some simple arithmetic paints a grim picture. If herd immunity occurred when more than 70% of the population has recovered and is immune and if the death rate for infected persons were to stay at 2.4% (the originally measured death rate for persons infected with COVID before treatments were perfected) then we could compute two figures. In the United States with a population of roughly 330 million persons the total population infected would be 330 million * 70% = 231 million persons infected. Without advanced treatments or other countermeasures, the total number of deaths would be 231 million persons infected X 2.4 % death rate = 5.54 million deaths. Nature has a very harsh way of ending a pandemic.
The simulation embedded in this learning environment recognizes that human will react when others around them stat to die by activating a range of human countermeasures. These countermeasures will over time decrease the infection rate and help to bring the surging pandemic under control. As the death rate subsides, humans will seek to return to “business as usual”, which will have the reverse effect of loosening restriction that will increase infections once again. Figure 3 below depicts these causal forces.

Interestingly, when these human reactions are coupled to the dynamics of the virus itself, a new overall dynamic pattern emerges within the pandemic system. The pandemic is no longer one big surge that sweeps across the whole population until herd immunity is attained. Rather a repeating cycle of surges followed by remissions emerges as humans first take on and subsequently abandon precautions in response to increasing and then decreasing death rates. In the very first simulations that Ali completed in March of 2020, even before the first surge had peaked, his model was showing that these repeating surges could keep on going for a long time into the future. Ali’s model makes some specific assumptions:
- A key assumption is that as the Death Rate approaches and then exceeds certain “threshold” levels, human behavior changes. We humans decreases infectivity by wearing masks and increasing personal hygiene and reducing the frequency of social contacts.
- In your simulator, assumptions about human behavior are aggregated to create two broad categories of Social Response: Medium Caution and High Caution. In the medium caution scenario, the whole population makes moderate efforts to mask and keep socially distanced in the face of a rising death rate. In the high caution scenario, the population’s responses are similar, but stronger.
- • Also, as time wears on the “Frustration” option assumes that all populations become weary and less responsive than they would otherwise be.
Simulate Behavioral Countermeasures— Make three new runs. Below are three runs that will help you better to understand how behavioral countermeasures absent any vaccines or new variants function in Ali’s model.
Make Sure that your Base Case has Infectivity = .04 and Contacts =15
Medium Caution Social Response. You get this run by clicking the appropriate button under “Social Response” in Mode 2 of the Scenarios/ Policy Features page.
High Caution Social Response. Click the other options to see what difference a more behaviorally careful population makes.
High Caution Social Response with Frustration. Click these two options both found under Mode 2 in the Scenarios/ Policy Features page at the same time to see what happens in Ali’s model when a careful population becomes frustrated and less responsive over time.
As you make these runs, try to tell yourself a story that predicts what you think the simulator will do. Then compare these projections from your “mental model” against what you are seeing from the simulator. If the simulation results are not as you expected, you can learn a lot by trying to figure out why this gap exists between your expectations and the simulator’s actual performance. Also, you can look at the Self Test questions at the end of this part of the user’s manual. Answers to the questions are provided in the appendices. Here are some additional hints:
Hint #1: The repeating surges in Death Rate and Total Incidence may be hard to see and appreciate because of how the graphs are scaled. If you click next to the “Baseline” scenario, it will vanish from view, giving you a better scaling on the vertical axis to see the repeating surges.
Hint #2: Do not make changes in Mode 1 parameters when making runs in Mode 2. Reset all values from Mode 1 back to their base values: Infectivity = .04 and Contacts = 15.
Self-Test Questions for Part 3:
Understanding Behavioral Countermeasures of the Whole Population
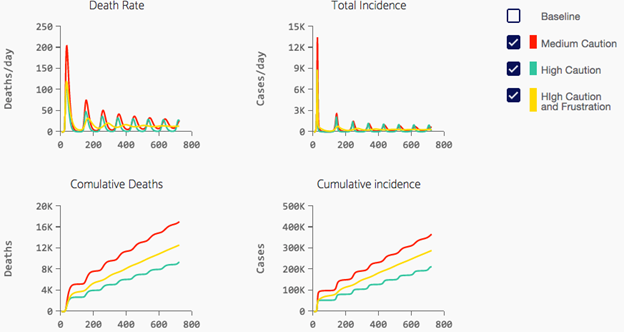
Q1: In the curves for Death Rate and Total Incidence, why are the initial surges so large?
Q2: Why do the smaller surges in the “Medium Caution” run keep on repeating (to see this effect better, make sure that you have clicked off the “Baseline” run to get better scaling)
Q3: Why do Cumulative Deaths and Cumulative Incidence keep rising in all of the scenarios up to (and beyond) day 720?
Q4: When you click back on the “Baseline” scenario, why are Cumulative Deaths in the Baseline scenario so much higher than in the Medium Caution scenario?
Q5: Why are Cumulative Deaths in the High Caution scenario so much lower than in the Medium Caution scenario?
Q6: What is the overall effect of the “frustration” scenario in these runs? How does Frustration change the overall system behavior when the base population is highly cautious? Why might that be?
