
COVID-19 Policy Simulator and Learning Environment
Public Outreach Division
Department of Disease Control (DCD)
Ali Mashayekhi, Emeritus Sharif University of Technology
Dan Gordon, Retired
NYS Department of Health
David Andersen, Emeritus
University at Albany-SUNY
Luis Luna-Reyes
University at Albany-SUNY
Part 4: Explore Vaccinations as a Policy Option
Vaccines are arguably the most potent tool in our medical and policy toolbox for combatting the COVID-19 pandemic. Unfortunately, it takes time to develop and test safe and effective vaccines. In Ali’s model effective vaccine capacity starts to roll out around day 300 of the pandemic (even though vaccine development started at day 180 –there is a several month delay between starting the program and seeing results). In Ali’s model, several key parameters define how effective a vaccine program will be:
Vaccine Effectiveness – this specifies the fraction of infections that the vaccine will prevent among persons who are vaccinated. The base value of .9 means that among vaccinated persons the incidence rate will be only one tenth (0.1) as high as among unvaccinated persons who are subject to the same exposure levels.
Willingness to be Vaccinated – Not everyone is willing to be vaccinated (as we know…) This value indicates the fraction of the population that is willing to be vaccinated.
Time when Vaccine is First Available – The base value of 180 (days) means that it takes that long from the beginning of the simulation for a vaccine to be developed and deployed. Even after deployment starts it takes a few months for all willing persons to be vaccinated.
As you vary these parameters for each run, you can create scenarios where a vaccination program is taken by more (or fewer persons) and the vaccine itself is more (or less) effective by simply sliding a lever on your screen. Wish it were so simple in the real world!
In addition, the simulation assumes that over time a fully vaccinated population will be depleted as some persons lose their protection and return to the susceptible pool. (So, it is not really possible in this model to totally eliminate infection and produce a scenario with zero growth in Cumulative Infections).
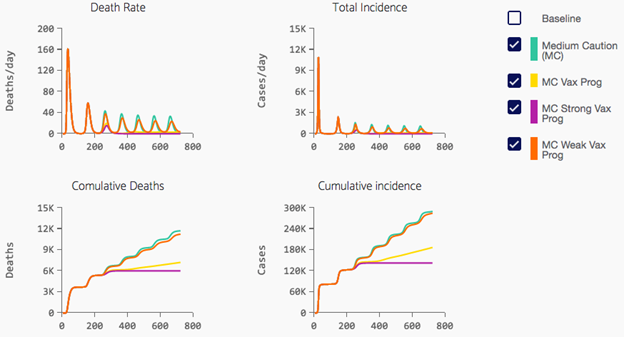
Simulate Understanding Vaccinations. You should make the following three runs to understand better how vaccines work in the simulator, using Medium Cautious Social Response.
- High Effectiveness, Medium Population Willingness. Set human behavior to “medium social response” and turn on the “Vaccine Program” with Vaccine Effectiveness = 85% and Willingness to Vaccinate = 70%.
- Very High Vaccine Effectiveness and Population Willingness. Repeat the simulation above with both vaccine effectiveness and willingness to vaccinate set to >= 95%.
- Medium Vaccine Effectiveness, Low Population Willingness. Vaccines for rapidly changing viruses such as the flu may have an effectiveness that may be closer to 50% than to 90%. A population that is skeptical or mistrustful of vaccination might have a willingness in the range of 50% or even less. Simulate a weaker vaccination program using these lower parameter values.
Finally, here are some tips and hints as you are making your vaccination runs:
- Do not try to understand the effects of vaccinations until you have worked some with the basic dynamics of the pandemic with no human counter-measures (Mode 1 in Part 2 of this manual) and understand a more about how human behavior influences the dynamics of the pandemic as discussed in Part 3 of this manual.
- On the “Mode 1” page, make sure to set Infectivity = .04 and Contacts = 15 for these experiments
- On the “Mode 2” page, only turn on “Medium Caution Social Response”
Self-Test Questions for Part 4: Explore Vaccinations as a Policy Option
Q1: Why is it that before day 200 all of the scenarios print over each other exactly, with no difference between any of the scenarios?
Q2: Somewhere around Day 300, the Cumulative Deaths curve bends to be almost flat for the Medium Caution with vaccine scenario but remains growing for the Medium Caution Scenario. Why is that?
Q3: The Death Rate for the Medium Caution with Weaker Vaccination still shows repeating surges and never seems to flatten out. Why is that?
Q4: Compare the Medium Caution Scenario to the Medium Caution with Vaccines scenarios only between day 200 and day 800 (because before day 200, there was no effective vaccine program in place). How many Cumulative Deaths occurred in this period under the Medium Caution only scenario? How many Cumulative Deaths occurred in this period under the Medium Caution with Vaccinations scenario? Can you estimate what fraction of Cumulative Deaths were avoided because of the Vaccination program?
