Throughout this spring, I have been returning to Ali’s model to review the many lessons that it has for us humans as we face the Corona virus. This morning, in a moment of whimsy, I started thinking about what this pandemic story might look like from the virus’ point of view.
I imagine that a virus existence would, in the end, tell a harried and desperate story (if only a virus could tell a story). Once the virus is lucky enough to find a human host, it has only five to ten days to move on to another human host. At the end of that time, the host’s immune system will have figured out how to kill off the virus. I would imagine that a virus has to be always vigilant, never missing a chance to move on to a new host. Every human hug or handshake provides an opportunity. Coughs, especially coughs in a crowded room, are some sort of a bonanza. A virus should always hope that no one is washing it off human hands or scrubbing it off of doorknobs or light switches. It must be discouraging to the virus to realize that no degree of diligence on its part will help unless humans stop paying attention and lower their defenses.
The model can be seen as telling a viral story of a battle played out in four phases.
Phase 1: Opportunistic and Ever-prepared Virus vs. Clueless Humans. In this first phase, it must be swell to be the virus. Every human hug, handshake and cough provides an opportunity to advance and prosper. The model posits (and recent history confirms) that in this phase humans aren’t aware or convinced of the seriousness of the threat and don’t act defensively. On average the virus easily finds two to three new hosts during the short time it has until its current host becomes immune (or dies). It’s a good time to be a virus.
Phase 2: Triumphant Virus vs. Awakening Humans. In Ali’s model, the viruses never change their behavior. They are persistent and opportunistic. They become triumphant as the number of human hosts can in some cases double in less than one week. Such exponential doubling is about the most powerful growth force we know about. But in the end, the very power of this exponential force “wakes up” the human population. The model specifies that humans can and do change their behavior. They start to be careful to wash their hands, to maintain social distance, and even to reduce contact levels by shutting down schools and businesses. As the humans become more vigilant, the virus’s triumphant phase starts to decline. The turning point, the point where the rapid growth phase is over, comes when the virus in one infected person finds, on average, only one new human host.
Phase 3: Receding but still Vigilant Virus vs. Vigilant Humans. In this third phase, humans turn the tide. The same behaviors of social distancing and reduced contacts that were strong enough to turn back the triumphant virus now begin to make big wins for the humans. In Ali’s model, the virus infecting each human cannot find, on average, one replacement host human. So, the number of humans “hosting” declines. This is a tough time for the virus: if this trend were to continue for a long time, the number of human hosts would shrink to near zero and the virus might disappear altogether.
Phase 4: Opportunistic Virus vs. Distracted Humans. As the story unfolds in the model, it is fortunate for viruses that the human population has a short attention span. As the immediate threat of the virus seems to fade into the past, humans relax and revert to earlier, less vigilant behavior. The virus, however, never relaxes, never loses focus. This phase sets up a second wave of COVID-19 infection among the humans.
An additional lesson from the model is that the decline of the virus as a public health threat doesn’t necessarily require us humans to remain highly vigilant forever. If humans develop and distribute an effective vaccine then the virus in an infected person, no matter how aggressively opportunistic, will rarely find a susceptible replacement host. Similarly, if all or most humans develop immunity through exposure to the virus (we call this “herd immunity”), the virus will rarely find a replacement host. (Dan adds: As of this writing it has not been established how long immunity lasts in persons who have recovered from COVID-19 infection.)
As long as even a few hosts (i.e. people) carry the active virus (biologists tell us that animals other than humans can also be hosts) and as long as there is no vaccine, the waves of infection seen in the model can repeat until the herd immunity is reached in the human population.
This Story Has a Lesson
The model tells a story about interactions between two populations — Corona virus and humans. This story looks at the COVID-19 pandemic from the viewpoint of an opportunistic and aggressive virus that sticks to its game plan in its struggle to reproduce and not go extinct. To a large degree, the shifting response of humans – now vigilant, now relaxed – enables the virus to prosper and advance.
Read More to Dig Deeper
We, the authors of these diaries, are professionally trained mathematical modelers. When we speak about models to one another, we use mathematical equations, computer code and simulation output. You can get a better feel for this kind of discourse by looking at Ali’s PowerPoint files attached to this and other diary entries or better yet by opening the model in Vensim and inspecting it. A free copy of VensimPLE or the Vensim Model Reader for personal use can be downloaded from this link.
We try to avoid this technical jargon in writing these diary entries, preferring to use ordinary language to tell the story. The one exception so far has been in the diary entry, “How to Stop a Pandemic” where we used some math. In that story, we resorted to math to make the point that there is a clear, mathematical logic driving the several ways that a pandemic can end—widespread death vs. vaccine vs. shutting down the economy and schools vs. smart use of public health measures such as trace-back and quarantines combined with continued social distance.
Here for the first time we show some computer output from the realistic but synthetic pandemic that exists in Ali’s model. Figure 2 shows the first wave of the pandemic as it occurs in the model over 110 days. Three variables are plotted—the total stock of infected persons and two daily flows of those persons becoming infected and those persons recovering. The four “phases” in the Virus’s tale are marked on this output. We show this output for two important reasons. First, these graphs clearly illustrated very large differences in the scale of the epidemic during its several phases. Phases 2 and 3 are large scale confrontations between virus and humans, with hundreds of thousands of humans getting infected and tens of thousands dying. If we were to think of the pandemic as war, this is large scale combat engaging whole armies, with many causalities.
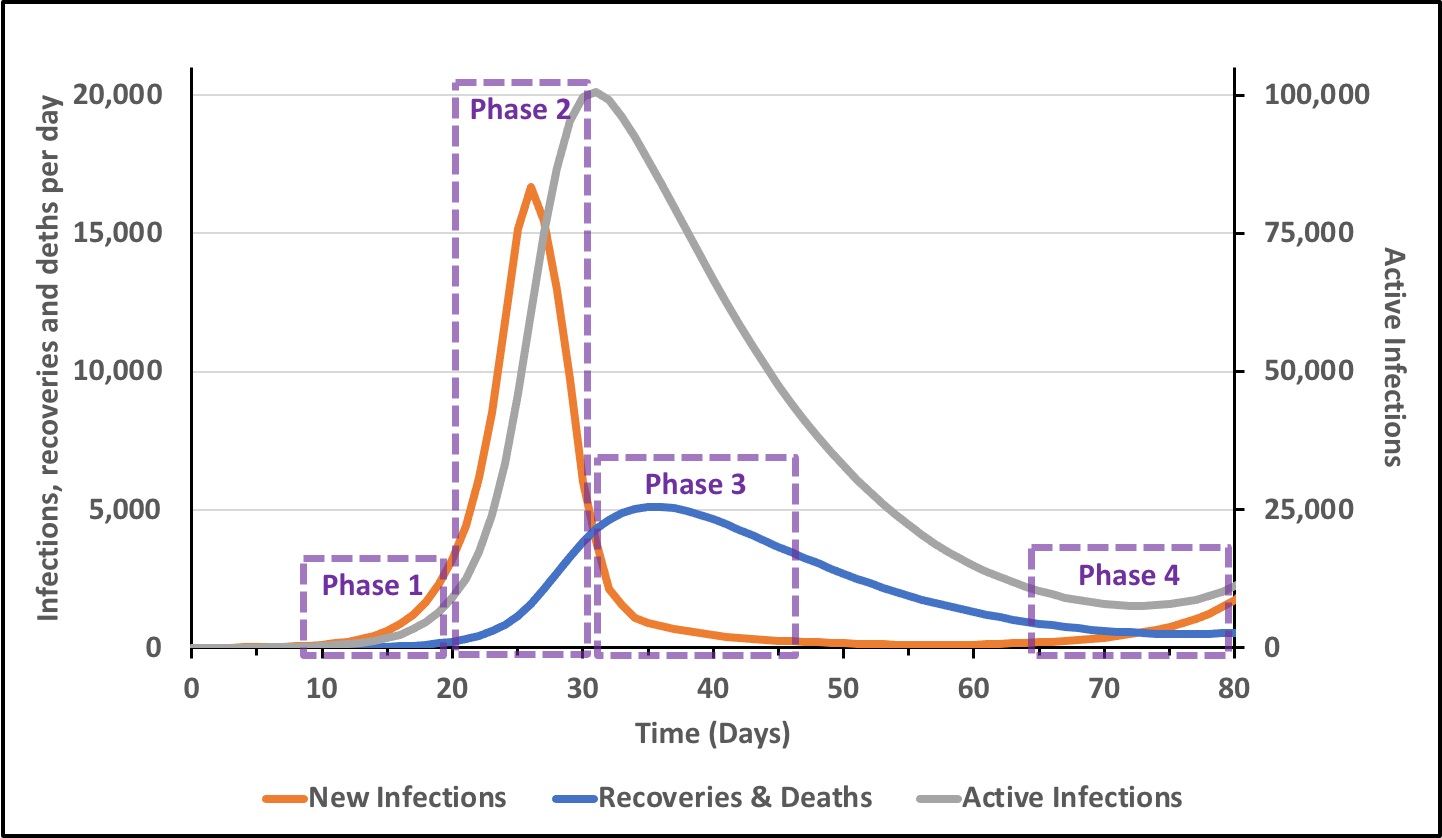
and Deaths, and Active Infections (infected persons), with four phases of the Virus’s Tale overlaid.
Phases 1 and 4, by contrast, are fairly small in scale. To use the war analogy again, these are small skirmishes involving only hundreds of humans in total. Note that in Figure 2, new infections in both phases 1 and 4 seem to be just flat lines near to zero. There is no big news to report. The activities of the virus are literally too small to see on the scale needed to visualize phases 2 and 3. From day 48 through day 65 there are fewer than 200 new infections per day in the entire nation of 80 million people. At around day 73 in this simulated pandemic the number of persons getting infected (the slowly rising red curve) crosses over the number of persons recovering from the pandemic (the slowly declining blue curve). On that day—the day that we can think of as marking the start of the second wave– there are 500 persons getting infected and 500 persons recovering (or dying) in the whole nation.
The big point here is not the exact day or the number of persons—this is a synthetic pandemic, after all. Rather, the point is that when the epidemic is still small it can be fought in smart, less costly ways than when it has grown to the scale of Phases 2 and 3. A coordinated, well-targeted effort to identify infected persons through widespread testing, trace their contacts, and quarantine potentially infected persons can locate and contain pockets of infection without shuttering schools and closing the economy, which become necessary in phase 2 and 3 of the first wave.
If we were to scale up the staffing requirements that New York State is requiring and that CDC recommends for such smaller-scale but smarter Test-Track-and Quarantine efforts, a nation of 80 million persons like Iran would need about 2,400 full-time public health workers. This cost of this would be minuscule compared with cost associated with shutting down the economy that would be incurred if the pandemic were allowed to swell back into Phases 2 and 3.
The second reason that we show these simulations from this synthetic pandemic is to illustrate how we can use math tools to make more precise statements about how the pandemic develops and what could work to control it. Phase 1 is dominated by exponential growth, though at a very small scale. Phase 2 witnesses a shift away from Phase 1’s pure dominant growth mode towards a balance between forces of growth and forces associated with control, which are induced by increased social distancing and reduced contacts. The peak of the pandemic occurs at the beginning of phase 3 when the dominant mode shifts in favor of the controlling forces (recovery fueled by social distancing). Phase 4 witnesses a second crossover point between growth and control, when the virus’ tendency towards exponential growth again dominates the system and overwhelms the controlling forces of reduced contacts and increased social distancing. This shift is tremendously important: it is a mathematical fact that unless we act to maintain control we will find ourselves in phases 2 and 3 of a second wave of the pandemic.
Fortunately for us, the humans, as we face the possibility of a second wave we understand the danger and can be prepared. We can have the public health service fully staffed and trained. We can have testing widely available. We can have treatment beds and personnel available in our hospitals. We will know how to be more careful about masks, social distancing and avoidance of large gatherings. If we act decisively and smartly, if we humans remain vigilant and don’t get distracted, if we avoid sliding back to “business as usual”, we can be the clear winners in this next wave of the pandemic at a low economic cost.