With the holidays upon us, it seems as if everyone has some person(s) that it is especially important to be in touch with. This year, for Deborah and me those persons are our youngest daughter and her family. Madeleine is a first-grade teacher in Brooklyn. Back in March she and her wife and toddler son mover out of Brooklyn to live with her in-laws in Rhode Island. Lots has happened since last March. Madeleine has continued to teach remotely. She has become pregnant, and just last week she and her family moved to Northampton, marking the spot in the Pioneer Valley that has become the target for their final exodus from Brooklyn.
Through all these changes, we have not been able to keep in close touch. The move to Northampton opened a new idea. Northampton is a short one and a half hour hop for us over the Berkshires. Maybe we could devote one or our periodic “vagabonding” days to a quick in-and-out visit. Would that be safe? Would that be legal? Can we wait? Should we wait?
As Deborah and I here having these discussions, Ali, Dan, Babak, and I were approaching much the same issue from the point of view of refining some of the scenarios in Ali’s model. We had been discussing a small set of equations in the model that depict several scenarios for a population’s “natural” response to rising death rates from the COVID-19 pandemic (see the Diary entry of December 1 “What Causes the Shape of the Pandemic?” for more details). In a nutshell, these equations posit that human populations respond to a rising death rate by spontaneously reducing contacts and actions that increase infectivity. These natural responses are what keep the pandemic from exploding to infecting tens or even hundreds of millions of persons and hundreds of thousands or millions of deaths. These dynamic reactions are also basic causes of the repeating peaks in infections that we are now experiencing. Ali’s earliest work demonstrated how a simple set of assumptions about human behavior, backing off when death rate gets too high and relaxing when the death rate recedes, is a primary driver of recurring waves of the pandemic.
Over several weeks of online Zoom discussions, the four of us had been discussing ways that these original and “natural” responses may be emerging and developing during the pandemic. We discussed three new forces now at play.
- Compliance with public health authority directives. As the COVID-19 pandemic continued, public health services have developed a wide range of mandates to guide population behavior, with varying degrees of enforcement. People’s compliance with these directives seems to vary from place to place and from time to time in ways that differ from what we had envisioned as the “natural” response.
- Development of Long-Term Frustration and Fatigue. Over time people’s willingness to observe reasonable restrictions erodes as they seek to return to more “normal” levels and modes of interaction.
- Developing Safer Protocol-Driven Behavior. An important result of our reflections on the pandemic has been the development of protocols for managing our home “bubbles” and our social networks (see Diary entry of July 29, “Using the “Egg Club” Protocol to Promote Hospitality”). These complement the community and workplace-wide protocols that are determined by the public health authorities.
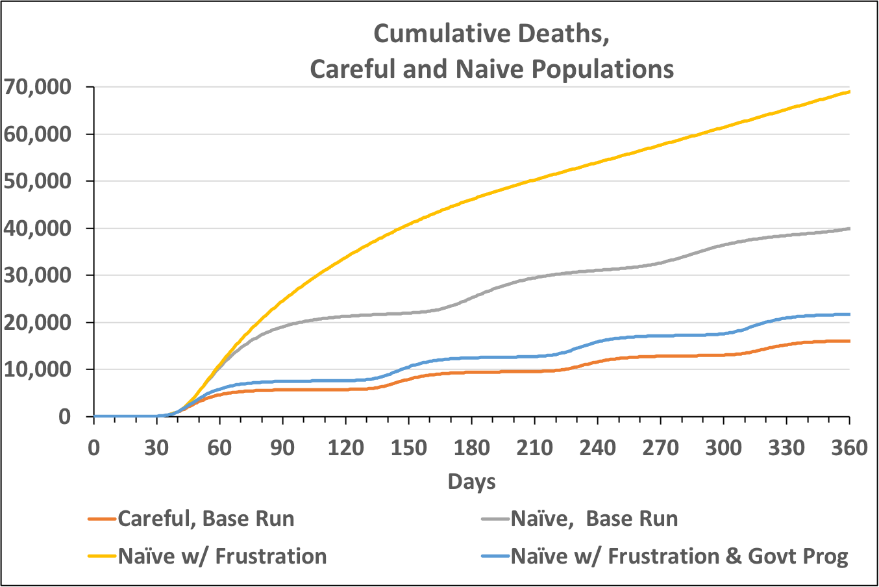
The accompanying figure illustrates how the nature of the population’s responses to rising and falling death rates could shift the number of persons who die during the course of the pandemic. The lowest curve (red) represents a Careful population that routinely observes social distancing and hygiene protocols. The “Naïve” baseline curve (in gray) represents a population that responds in a laissez-fair or less strong manner to increases in the death rate (in Ali’s model that we have been using all along, we referred to this as the “Scenario Two” population). Ali modified this basic scenario by adding some equations meant to simulating the behaviors of this naïve population who get frustrated by the social costs of distancing and hygiene restrictions over time and become less compliant the longer the restrictions persist. In addition, Ali speculated on what would happen if this naïve, frustrated population, were faced with a government (public health) program that vigorously enforces social distancing and hygiene practices. These scenarios are not based on calibrated data, but they do illustrate how the overall nature of a population’s response, including compliance with government mandated programs and paying attention to carefully designed safety protocols, can save lives. Conversely, becoming frustrated and hence less diligent than even a naïve population creates a scenario that is very costly in terms of overall deaths. Not shown in this figure is the even better than “Careful” run that might occur if a careful and protocol-abiding population co-existed with a strong public health program of full-population testing and quarantining.
In the end, Deborah and I decided that it would be both legal and prudent to adapt the Egg Club Protocol in service of a fast in-and-out trip across the Berkshires. On a mild and sunny day, we drove 90 minutes across the Berkshires for a one hour walk on the campus of Smith College. We had a picnic lunch at a particularly long outside table that let our two parties stay six feet apart. We wore masks when we used the toilet in Madeleine’s apartment. The time we spent together may have been drastically curtailed compared to a “normal” visit, but it was wonderful all the same!
This Story Has a Lesson
Back in March, Ali’s base model described several scenarios that encapsulated a theory of population reactions to rising deaths. These “natural” death-avoiding scenarios are key to understanding both why the pandemic did not explode to encompass the entire population, but also why it continues to present in successive waves of infection. We perceive three classes of population response: (1) Compliance with government regulations, (2) Developing long-term fatigue and frustration, and (3) Developing safer protocol-driven behaviors. In Ali’s model, these scenarios can and do change the timing and magnitude of second and subsequent waves of the COVID-19 pandemic.
Read More to Dig Deeper
The infection rates, shown in the figure below, explain the large difference in cumulative deaths that are presented above. The base run with the careful population shows successive waves of infection, but they are relatively small and are quickly tamped down. The naïve population also shows waves, but they are higher and, very importantly, broader. That is, the total number of infections (the area under the curve) is a lot higher. Thus, the higher “total infections” manifests itself in the large differences in cumulative deaths. When the naïve population also responds to frustration, the first wave is very large and subsides only slowly. Even after it subsides, infections continue at a nearly constant rate that is quite high. The simulated public health intervention (“govt prog”) overcomes the effect of frustration and drives the infection rate down almost to the rate of the careful population. (Disclaimer: that’s not a guaranteed effect, of course. It depends on the program and how it’s enforced. The simulation model does not specify those details.)