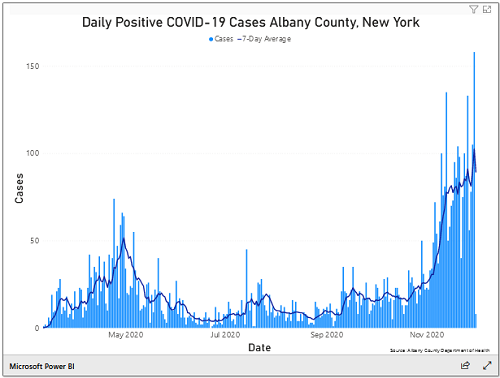
Back over the summer, my brother and I created a plan for him to come and visit us at New Fadum Farm over Thanksgiving. We had not seen Uncle Ted in almost a year and the data reported on the Albany County website over the summer months seemed promising. As the holiday season approached, the number of new COVID-19 infections seemed to take off. Was it still a good idea for him to make the visit?
The data for Albany county appeared to be showing repeated surges followed by remissions in the total number of persons infected. Why does this happen? What causes the second (and third and fourth) surge to start? Why do the surges eventually subside? Is there some way that we could dampen out these periodic peaks?
Ali’s simulation model starts to provide some answers to these questions. In the model, two key parameters drive both the surges and the turn arounds— (1) Number of Contacts per Day and (2) Infectivity. Contacts per Day represents the frequency of interactions between susceptible and infected persons. Contacts per Day is affected by the behaviors that reduce how much each of us gets out to interact with others. Infectivity represents the probability that one such contact between an infected and an uninfected person produces a new infection. Infectivity is affected by social distancing, mask-wearing, hand washing, and other such behaviors.
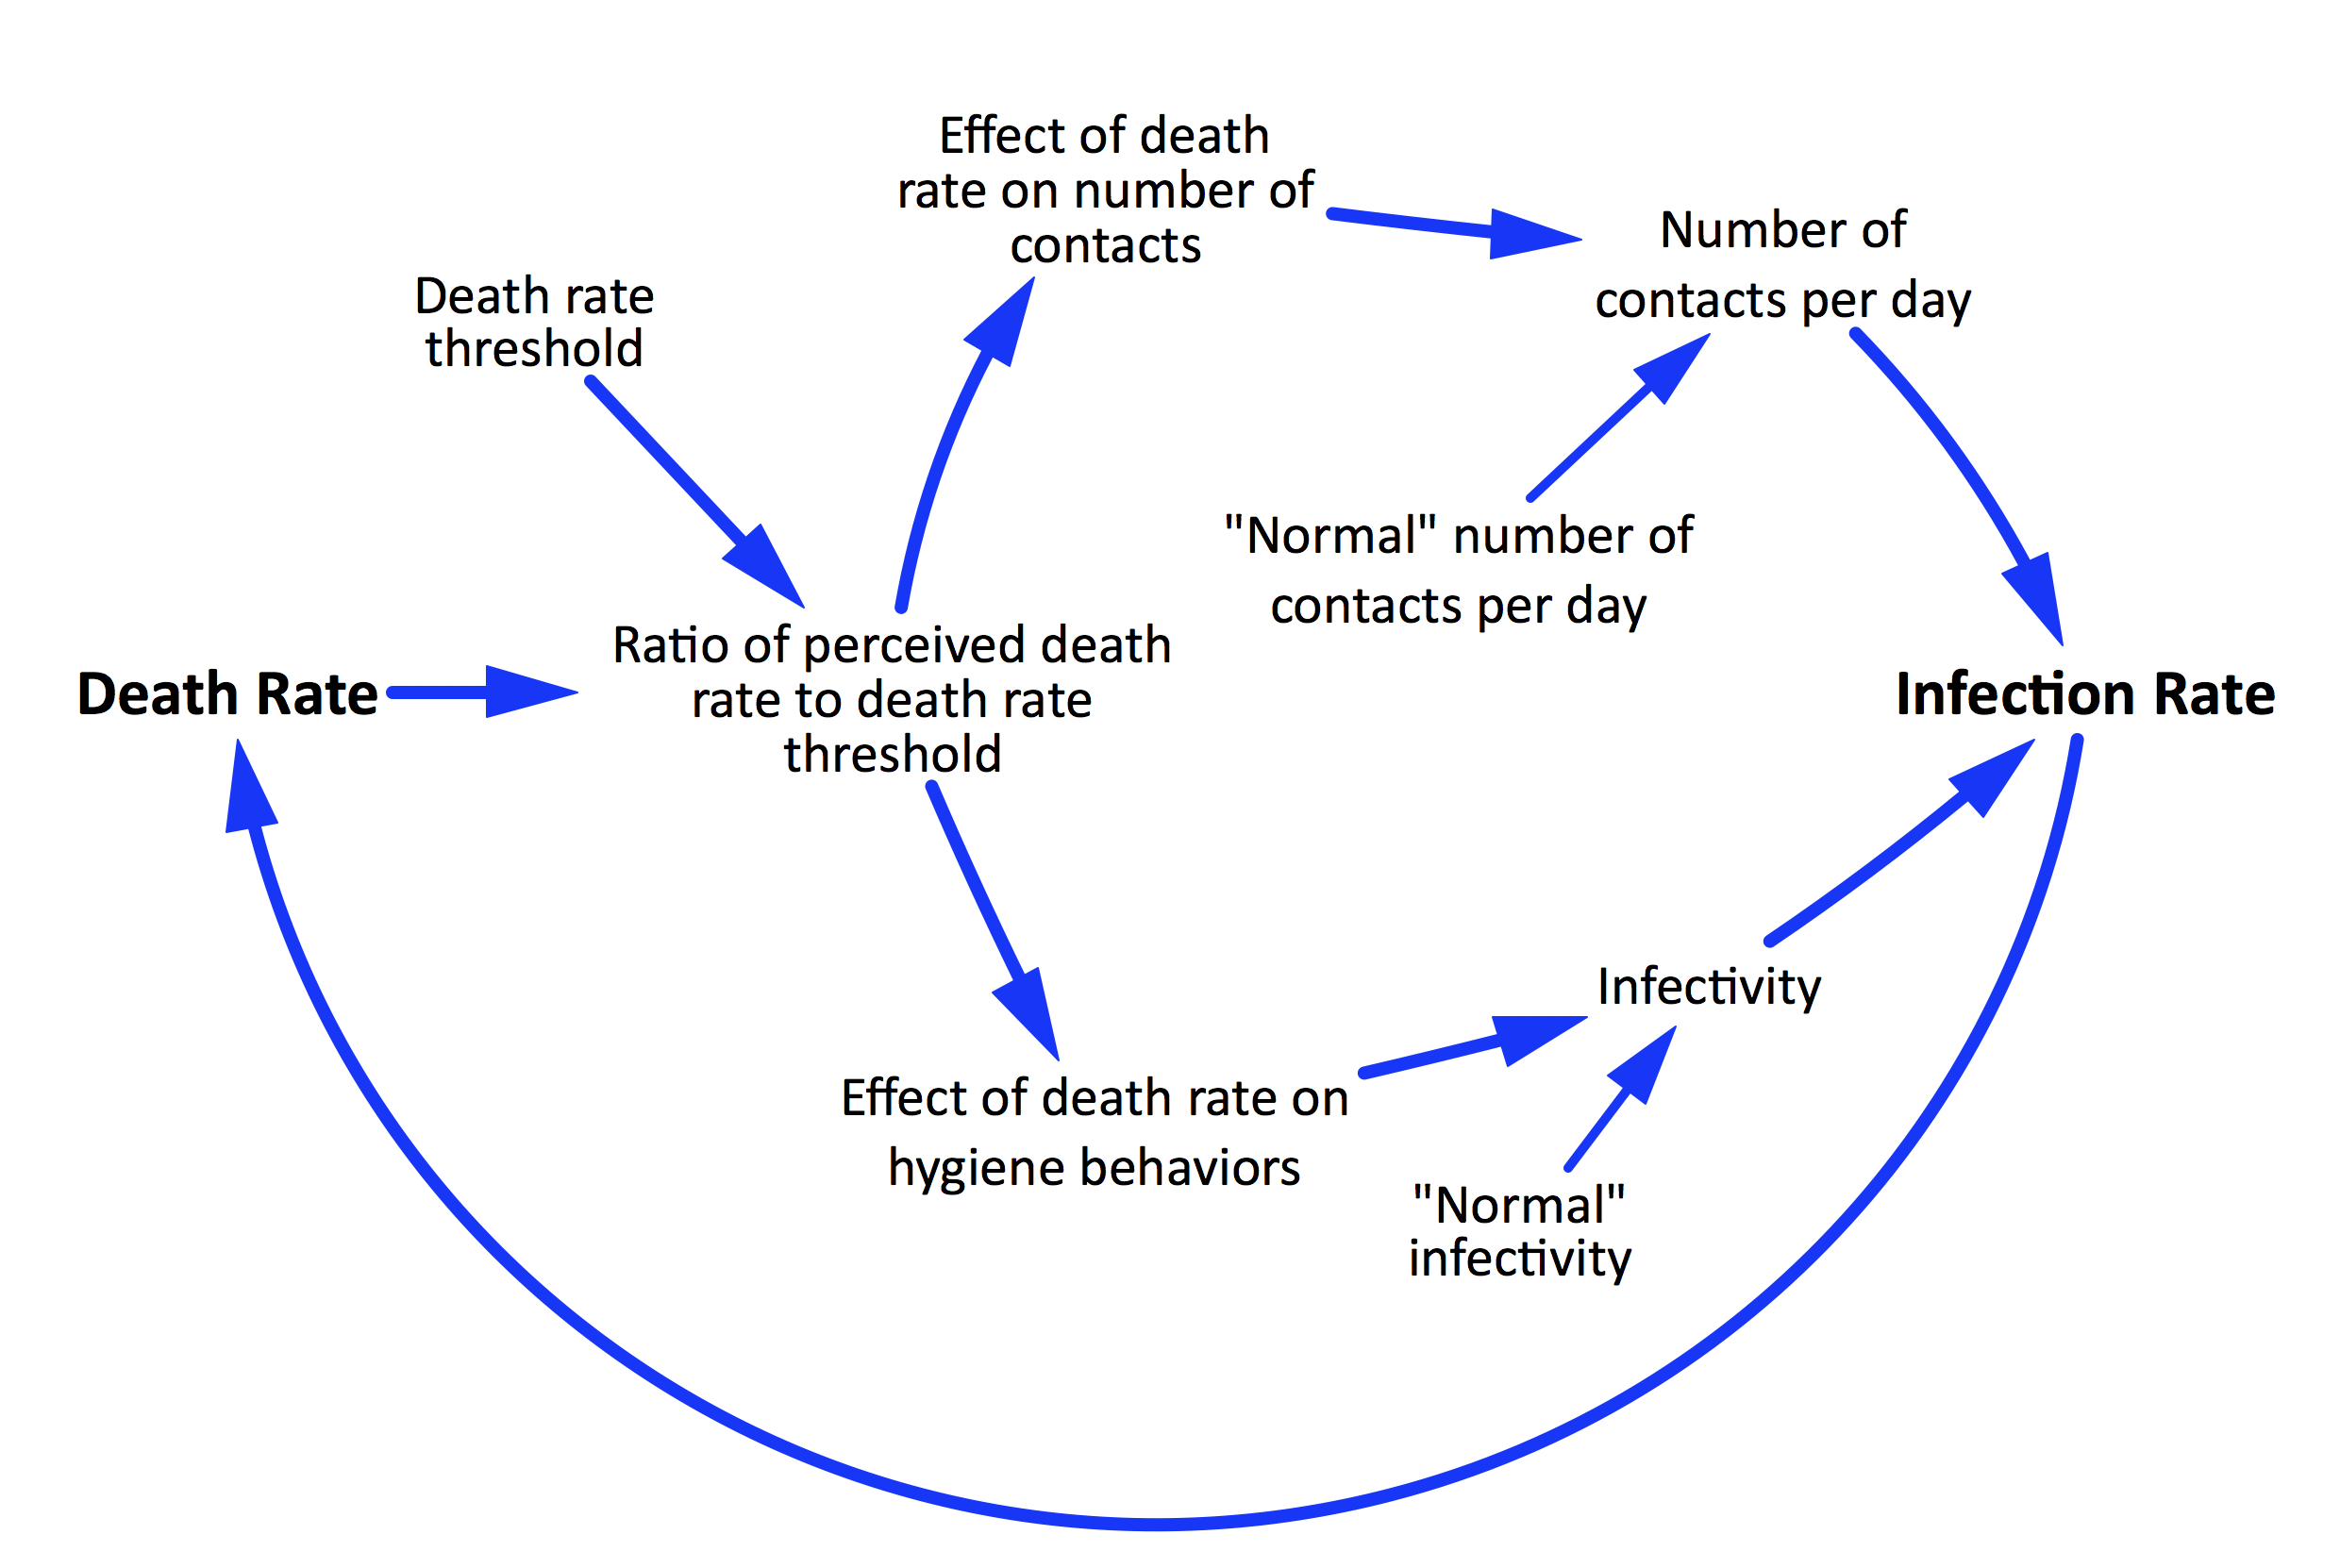
Figure 1 shows the causal structure used in Ali’s model. This rather technical-looking diagram lays out a quite simple theory of population response to a rising and receding death rate. As the perceived death rate approaches and then exceeds a pre-specified threshold, the population becomes more cautious and decreases both daily contacts (by staying home more and social distancing) and the probability of transmission (“infectivity”), (by wearing face masks and social distancing). When the death rate subsides, the population reverts to earlier behaviors. [Dan adds: You might argue that people respond to the infection rate or the hospitalization rate as well as to the death rate, and the model should include that. You’d be right – but the model would behave pretty much the same way and the takeaway lesson would be the same.]
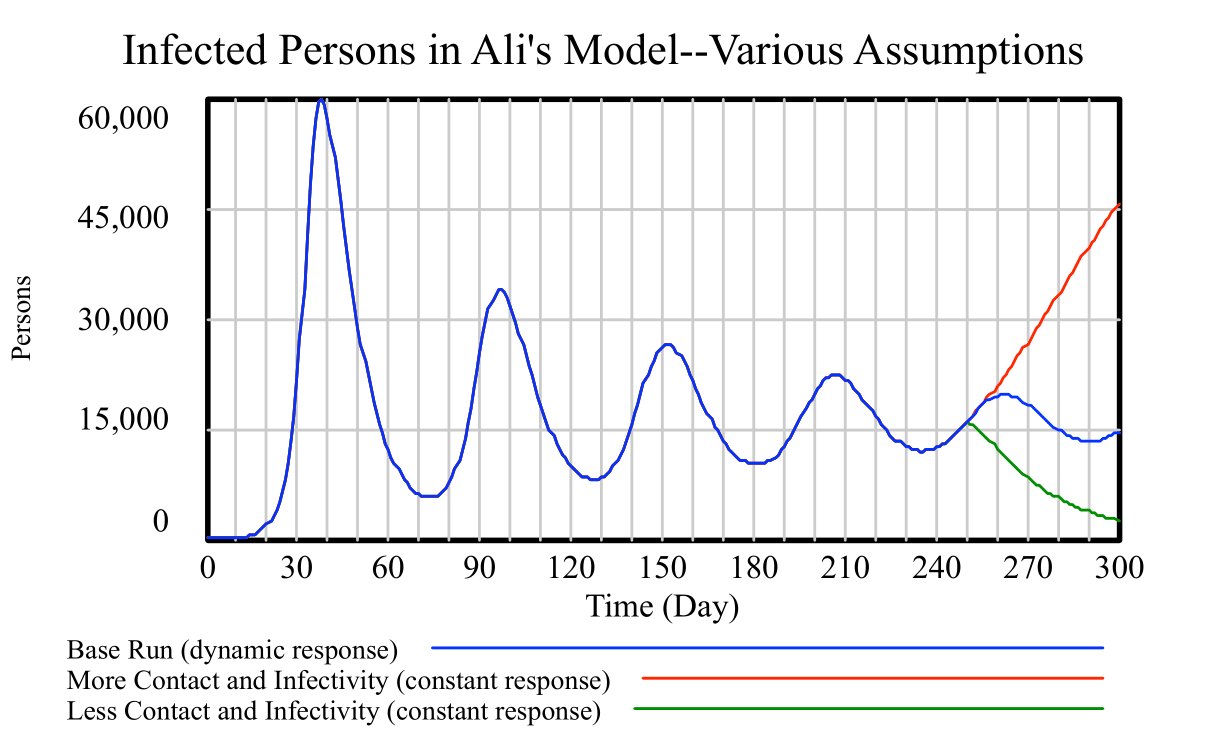
The base run of Ali’s model (Figure 2 – blue line) shows how this theory of population response plays out over time. This figure shows that the number of infected persons over the full course of the pandemic come in multiple waves. The set of influences shown in Figure 1 causes the infection rate to surge and recede as the death rate similarly surges and recedes. Our behavior as a community is dynamically linked to the surging infection of the virus itself. Put another way, in Ali’s model human reactions to the pandemic set up a dynamic that causes the infection rate to rise and fall in successive waves.
In the model, we tested this hypothesis by setting the level of contacts and infectivity within the model to a constant level (not reactive and not dynamic) starting on day 250. If contacts and infectivity are set at a relatively lower value, the pandemic relatively quickly extinguishes itself (Figure 2 – green line). On the other hand, if we as a population ignore the rising death rates from the pandemic and set our contacts and infectivity at a constant but somewhat higher rate, the pandemic takes off (Figure 2 – red line). If left unchecked, the simulated level of infected persons in the red curve would rise into the millions and most of the population would eventually become infected.)
So, what “causes” the surges in Ali’s models? We ourselves cause the surges by relaxing and reverting to our usual behaviors until the pandemic picks up again. What “causes” the turn around? We cause the turn around by being vigilant and keeping down our contacts, social distancing, and using face masks.
Deborah and I canceled the big plan to have Uncle Ted come up and visit us all for Thanksgiving. There was no big celebration this year. Ted did drive up and back from his home in Connecticut on the Saturday after Thanksgiving. I spent some quality time sitting alone with him out on the porch. Fortunately, it was a warm and sunny day.
This Story Has a Lesson
As early as last March, Ali’s model was showing periodic surges with second and third and even fourth peaks regularly occurring. For this model, the cause of these secondary and tertiary waves was clearly related to aggregate behavior of the whole population. As the perceived death rate approached and then exceeded a pre-specified threshold, the population became more cautious and decreased daily contacts (by staying home more and social distancing) as well as the probability of transmission (by wearing face masks and social distancing). When the death rate subsided, the population reverted to earlier behaviors. The secondary and tertiary waves resulted entirely from these behavioral shifts by the simulated population it the model.