
This past summer, several parents organized an outdoor version of our Church School on Sunday mornings. In September, the public schools opened for face-to-face classes wearing masks and with strict contact tracing. When our Church School followed suit I got to teach a unit on “Caring for God’s Creation”. Several of the kids even put up a website as part of the “October No Single-Use Plastics Pledge”.
next unit in this year’s Church School runs into Advent and the kids are planning to video record the annual Christmas pageant in contemporary dress. So, there will be no live pageant with wise men, shepherds, and angels this year. But will we be able to sing carols at a Christmas Eve service (implying we won’t have to wear masks)? Of course, this is the same question our whole society is facing. Is it safe to shop, eat, get a haircut, or whatever without a mask?
We are hearing that if the vaccine program goes well enough, we may be entering a new “endemic” phase. I looked up “endemic” and found the following definition in the dictionary:
ADJECTIVE:
- (of a disease or condition) regularly found among particular people or in a certain area.”
This definition raises three important questions. First, WHAT AREA? It seems that in the future this viral disease will be endemic to Upstate New York, the whole state, the United States, and probably the whole world. Second, WHICH PARTICULAR PEOPLE? At present it seems like future infections will be focused within the unvaccinated population, including children and those medically at risk, but since even fully vaccinated persons are at some risk of infection, just about everyone may ultimately be affected to some degree.
Which leads to the third question, WHAT DYNAMIC? This last question is where our simulation model might help. Earlier runs of model have shown that with a high enough level of vaccination in the population the rate of daily infections flattens out to a steady equilibrium level. Those runs also showed that introduction of a new highly infectious variant can disrupt the vaccine-induced equilibrium and reignite the pandemic. It seems possible that the dynamic pattern accompanying this new endemic equilibrium could be some form of an interruptible equilibrium. Ali’s model might be able to help us to probe more deeply to understand this (hopefully) soon-to-arrive equilibrium. Specifically,
- How prevalent will daily infections be in this new equilibrium. That is, will the steady level of new daily infections occur at a relatively high or relatively low level?
- Will the prevalent level of daily infections differ between the vaccinated and the unvaccinated populations? If yes, will that difference be large?
- What public health policies or other disease-related factors will determine the final equilibrium level—factors such as Fraction of the Population willing to get a first vaccine, or Fraction of the Population wiling to revaccinate, or duration of immunity from the vaccines.
- Is the new endemic equilibrium stable? Can new eruptions still occur?
- If new eruptions can still occur what factors or policies might cause (or prevent them)?
According to Wikipedia. the Spanish flu began in January 1918 land ended in December of 1920, just one month shy of three years. If the COVID-19 pandemic were following a similar pattern, we would now be about two thirds of the way through the pandemic. The real question is not whether we will have a live Christmas pageant and sing carols together this Christmas. Rather, will we be singling carols in church, shopping, eating out, and getting haircuts without masks in December of 2022?
This Story Has a Lesson
If current vaccine programs prove successful, the endemic phase of the COVID pandemic will contain a dynamic equilibrium. Not all equilibria are the same. We should begin now to explore five questions: (1) How prevalent will daily infections be in this new equilibrium. (2) Will the prevalent level of daily infections differ between the vaccinated and the unvaccinated populations? (3) What public health policies or other disease-related factors will determine the final equilibrium level? (4) Is the new endemic equilibrium stable? and (5) If new eruptions can still occur what factors or policies might cause (or prevent them)?
Read More to Dig Deeper
Figure 2 below is reproduced from the story of September 14,2020–“Even the CDC has flip-flopped on mandates to wear masks—Why is that?”. We’ll use it to jump off into a discussion of the dynamics of an endemic infection. But some caveats are in order first. Ali’s model is a mathematical abstraction and immensely simplifies a very complicated phenomenon. The precise parameters used in the model have not been carefully calibrated to all available data, so the model is useful for talking about general patterns of behavior, but not for making specific forecasts of infection levels in the real world. That said, there are some interesting observations about endemic dynamics as a general phenomenon.
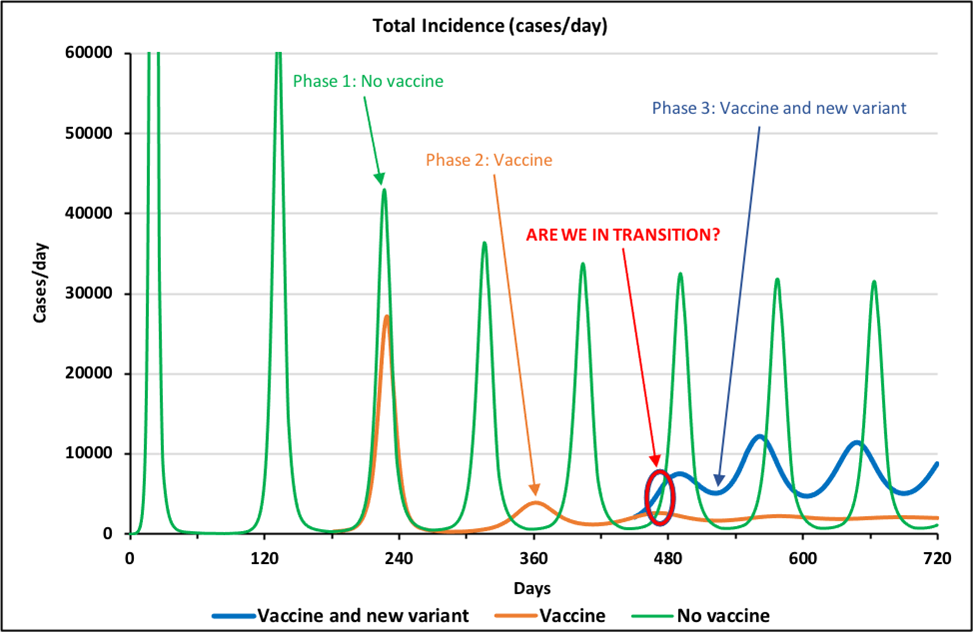
The green curve labeled, “Phase 1: No Vaccine”, illustrates that base long-term behavior of Ali’s model absent any vaccines or new variants (such as the Delta or Omicron variants). This pandemic starts with several very large surges that go off the plotted scale before settling into a pattern of repeating surges every four months or so. As discussed in earlier stories, these repeated surges occur because of human reactions to surging (and receding) patterns of deaths and widespread hospitalization and illness. As the situation gets worse, humans are more cautious in terms of social distancing and mask wearing and the contagion recedes, leading humans to relax their precautions and then the cycle starts over. The virus does not change. Behavioral shifts by the human population are causing the repeating surges.
The brown curve is the same situation with all the same human behaviors except in the first hundred days of the pandemic a vaccine starts to be developed and rolled out and soon thereafter 70% of the population is willing to take this vaccine which is 90% effective. The result is that after three smaller and smaller surges, the pandemic is under control. That is, in dynamic terms the pandemic has entered its endemic phase. It is still present. It can still return. However, there are no new surges (in this mathematical abstraction where nothing else happens).
The blue curve illustrates what happens if a new and more virulent strain of the virus arises (think of the Delta variant). Between days 400 and 450, the assumed infectivity of the virus in the simulation doubles and the assumed effectiveness of the vaccines drop from 90% to 80%. Figure 2 illustrates that under these conditions, the pandemic returns with repeating surges of lower amplitude (because the majority of the population is still vaccinated).
In sum, the situation of having 70% of the population take a 90% effective vaccine puts the system into an endemic mode where infections still occur but without surging. However, this mode is only partially stable and can be disrupted if other factors change. Dan ran some experiments to see how stable this endemic mode is. He explored sets of changes in values of three key parameters in Ali’s model. Here is what he found.
1) Willingness to Be Vaccinated. This parameter represents the fraction of the population that is willing to be vaccinated. The base run in Figure 2 confirms that when Willingness to be Vaccinated equals 70% (and Vaccine Effectiveness is 90%), the pandemic is contained. Dan systematically lowered this parameter while holding everything else constant. He found that when Willingness is around 70%, the system is actually only partially stable. This means that if Willingness to Be Vaccinated parameter drops even a little, it touches off a period of unstable damped oscillation before the system returns to a stable equilibrium. As we drop Willingness farther and farther (i.e., fewer and fewer persons are willing to be vaccinated) the system becomes less and less stable: the system shows larger surges that repeat for years until the oscillations finally die out and stability returns. Somewhere between 40% and 30% Willing to be Vaccinated, the system reverts altogether to large surges that continue indefinitely, as was the case in the base run without the vaccine.
2) Vaccine Effectiveness. In the base run (Figure 2), Vaccine Effectiveness was 90%. Dan explored the effect of having a less and less effective vaccine, other things being equal. Qualitatively, the results are similar to having fewer and fewer persons willing to get vaccinated. When Vaccine Effectiveness drops to around 30%, system reverts to sustained surges of infections. [Dan asks, if the vaccine were only 35% effective, would people want to take it? Maybe not, but having lots of people take a relatively weak vaccine would still have considerable effect on lowering the overall rate of infection in the population. This is a serious public health issue: what’s beneficial at the societal level may be unattractive at the individual level, and vice versa.]
3) Infectivity. Whereas Willingness to be Vaccinated is a characteristic of human behavior and Vaccine Effectiveness reflects a medical intervention, Infectivity represents how contagious the virus is. The Delta variant is more contagious than the original COVID-19 virus and the new Omicron variant is yet more contagious than Delta. As expected, when Dan increased Infectivity, he observed dramatic decreases in the stability of the simulated pandemic. When Infectivity rose by about 70% or more over its base value, the simulated system exhibited long-term repeated surges. (Note that in the real world the infectivity of the Delta and Omicron variants are more than double that of the original COVID-19 viral strain.)
A rough-and ready heuristic about endemic stability emerges from these “what-if” simulations. We use total incidence – the number of new infections per day in the population – to judge stability. That incidence depends on the product of four factors:
Vaccination Levels
- Medical Countermeasures Effectiveness
- Virus Characteristics
- Human Social Behaviors (e.g. Contact Frequency, Masking and Social Distancing)
In our model:
- Vaccination Levels are represented by Willingness to be Vaccinated
- Medical Countermeasures Effectiveness is represented by Vaccine Effectiveness
- Virus Characteristics are represented by Infectivity
- Human Social Behaviors are endogenously modeled by endogenous 1 variables representing contact frequency and hygiene behavior.
When the pandemic subsides and settles into an endemic mode, disruptions in any of these four areas can touch off renewed instabilities. If several factors change at the same time, even small changes may suffice to nudge the system into instability. For example, Dan found that (a) increasing Infectivity by (only) 30%, or (b) lowering Willingness to Vaccinate from 70% to 55% or (c) decreasing Vaccine Effectiveness from 90% to 67.5%, singly produced only modest short-term changes in the stability of the equilibrium, but changing all three at once pushed the system into long-term sustained oscillations.
It is important to reiterate the caveats we stated earlier. These simulations arise from a mathematical abstraction of a very complex phenomenon. Our dynamic hypotheses cannot accurately forecast future behavior of the system unless the model is more fully tested and calibrated against existing data. That said, we believe the model’s behavior yields valuable lessons that are indeed useful for shaping our understanding of the pandemic and guiding our responses to it.