
This holiday season, we seem to be in a big COVID-19 pandemic mess all over again. My daughter’s in-laws canceled their long-anticipated plans to fly up from Alabama. My sister’s son-in-law could not fly back to France with the rest of his family because his COVID test results were delayed. Overall daily infections in Albany County have reached an all-time high. News headlines seem to blame the rapid emergence of the Omicron variant for all this trouble.
But does Omicron alone account for everything that is going on? In our spare time here at New Fadum Farm, we have been making some informal observations. We’ve been watching broadcasts of holiday college football bowl games and some of the many NFL games. The cameras are showing packed crowds, all cheering loudly. Few are masked. Friends returning from travels to other states report walking out of bars and restaurants where staff and patrons were largely unmasked. The media have been reporting angry protests and legal challenges to mask mandates issued by state and local authorities. Indeed, state and local authorities sometimes even challenge each other.
Between Thanksgiving and Christmas, the overall vaccination rate at our dinner table remained almost stable—two grandchildren aged 7 and 10 “got the jab,” but one of our daughters has resisted getting a booster shot. The 3 grandchildren aged 4 and under remain unvaccinated and more vulnerable. Almost every family that we know has one or more relatives or good friends who remain opposed to being fully vaccinated.
While out holiday shopping, we observed that indoor mask-wearing varies a lot from store to store, even though county regulations mandate mask-wearing at all indoor public venues. At our supermarket and the CVS pharmacy everyone is masked., especially early in the morning when elders of our (vulnerable) generation seem to shop. At the package store or auto parts and repair shop, compliance is lower. At a rest stop on the highway, mask-wearing compliance was similarly mixed.
Finally, our news is filled with reports about how effective (or ineffective) each of the available vaccines are with regard to the new Omicron variant.
In sum, the current outbreak seems attributable not just to the emergence of the highly infectious Omicron variant. It seems to be a function of:
New variant properties and Human vaccination behaviors and Medical properties of vaccines and All the other human responses such as social distancing, mask-wearing, contact-tracing, diagnostic testing, and quarantines.
However, Ali’s model indicates that the combined impact of these factors goes beyond a simple sum of the individual effects. In the model there is a tipping point with respect to how the epidemic proceeds. Several small “shoves”, none of which is enough to make a big change in the pandemic’s behavior, can combine to push the pandemic over this tipping point and re-launch the pandemic into a new, explosive mode.
Sure, the pandemic is coming back this holiday season. But the Omicron variant is not the whole story. Our human behaviors are likely making a poor situation worse than it has to be.
This Story Has a Lesson
The Omicron variant is a major contributor to the current global surge in the pandemic. However, three other major forces—forces under the control of us humans—are now interacting with the Omicron variant: (1) Human vaccination behaviors, (2) Medical properties of vaccines, and (3) All the other human responses such as social distancing, mask-wearing, contact-tracing, diagnostic testing, and quarantines. Collectively the Omicron variant plus these three forces push the pandemic into a regime where its internal dynamics take over to make a bad situation much worse. All those additional forces are of human origin. To a large degree, we are making our own situation worse than it might be.
Read More to Dig Deeper
As we have already seen in these technical notes, the base behavior of Ali’s model is characterized by a pattern of repeating surges in infections . These surges develop from competition between two forces. The first force originates with the virus itself, which always seeks to replicate itself. Contact between susceptible and infected humans touch off a reinforcing cycle of ever-increasing infections, which in the absence of any reaction by the human population would eventually infect nearly everyone with ensuant wide-spread illness and death.
The countervailing force, working against the virus, is of human origin. In the model, as deaths start to rise, people react by decreasing contact frequency and intensity (social distancing), reducing the likelihood of viral transmission (wearing masks), and through other policies such as testing, quarantining, and even government-sponsored lockdowns.
In the model there are mathematically determined turning points that determine whether the epidemic rises or falls. When new infections (i.e. incidence) become (much) greater than daily recoveries , a surge starts to take off. At this time the epidemic’s behavior is being driven primarily by viral infectivity. A second turning point is when the number of daily infections drops below the number of daily recoveries. In our model, this point is largely determined by the effects of human countermeasures. (Of course, incidence also becomes lower than recoveries if the epidemic proceeds to the point where herd immunity has been reached, but we certainly want to stop COVID-19 before the number of persons ever infected is that high.) These countermeasures, which drive down the incidence rate, include actions such as mask wearing, social distancing, quarantines, government-sponsored lockdowns and, in the longer term, mass vaccination. In contrast, the recovery rate in the model is not affected by such actions. A constant fraction of the stock of infected persons, which is determined by the average duration of illness, recovers each day, though dynamic effects such as hospitalization can reduce the death rate.
Ali’s model assumes that the human population has no long-term learning and hence repeats a path of first increasing and then relaxing countermeasures. This assumption, alas, appears to be supported by evidence from the first two years of the pandemic.
In the model, vaccines are an exogenous force that interrupts these repeating surges. Dan implemented a 90% effective vaccine that 70% of the population is willing to take. As vaccinations come online, the surges recede and after several rounds of decreasing amplitude, the epidemic settles into an equilibrium where an equal number of persons is becoming infected and recovering each day. The virus is still present, infecting persons, causing hospitalizations, and even killing people. But there are no major surges. (In the real world, of course, there are other factors, like weather patterns, that will cause incidence rates to rise and fall.)
This stable incidence rate is characteristic of the “endemic” version of the pandemic. Dan conducted some experiments to investigate the how stable the endemic equilibrium rate really might be. In one series of tests he started with the model in equilibrium conditions (i.e. steady, low incidence rate) and made relatively small changes in each of three key parameters. The results are shown below.
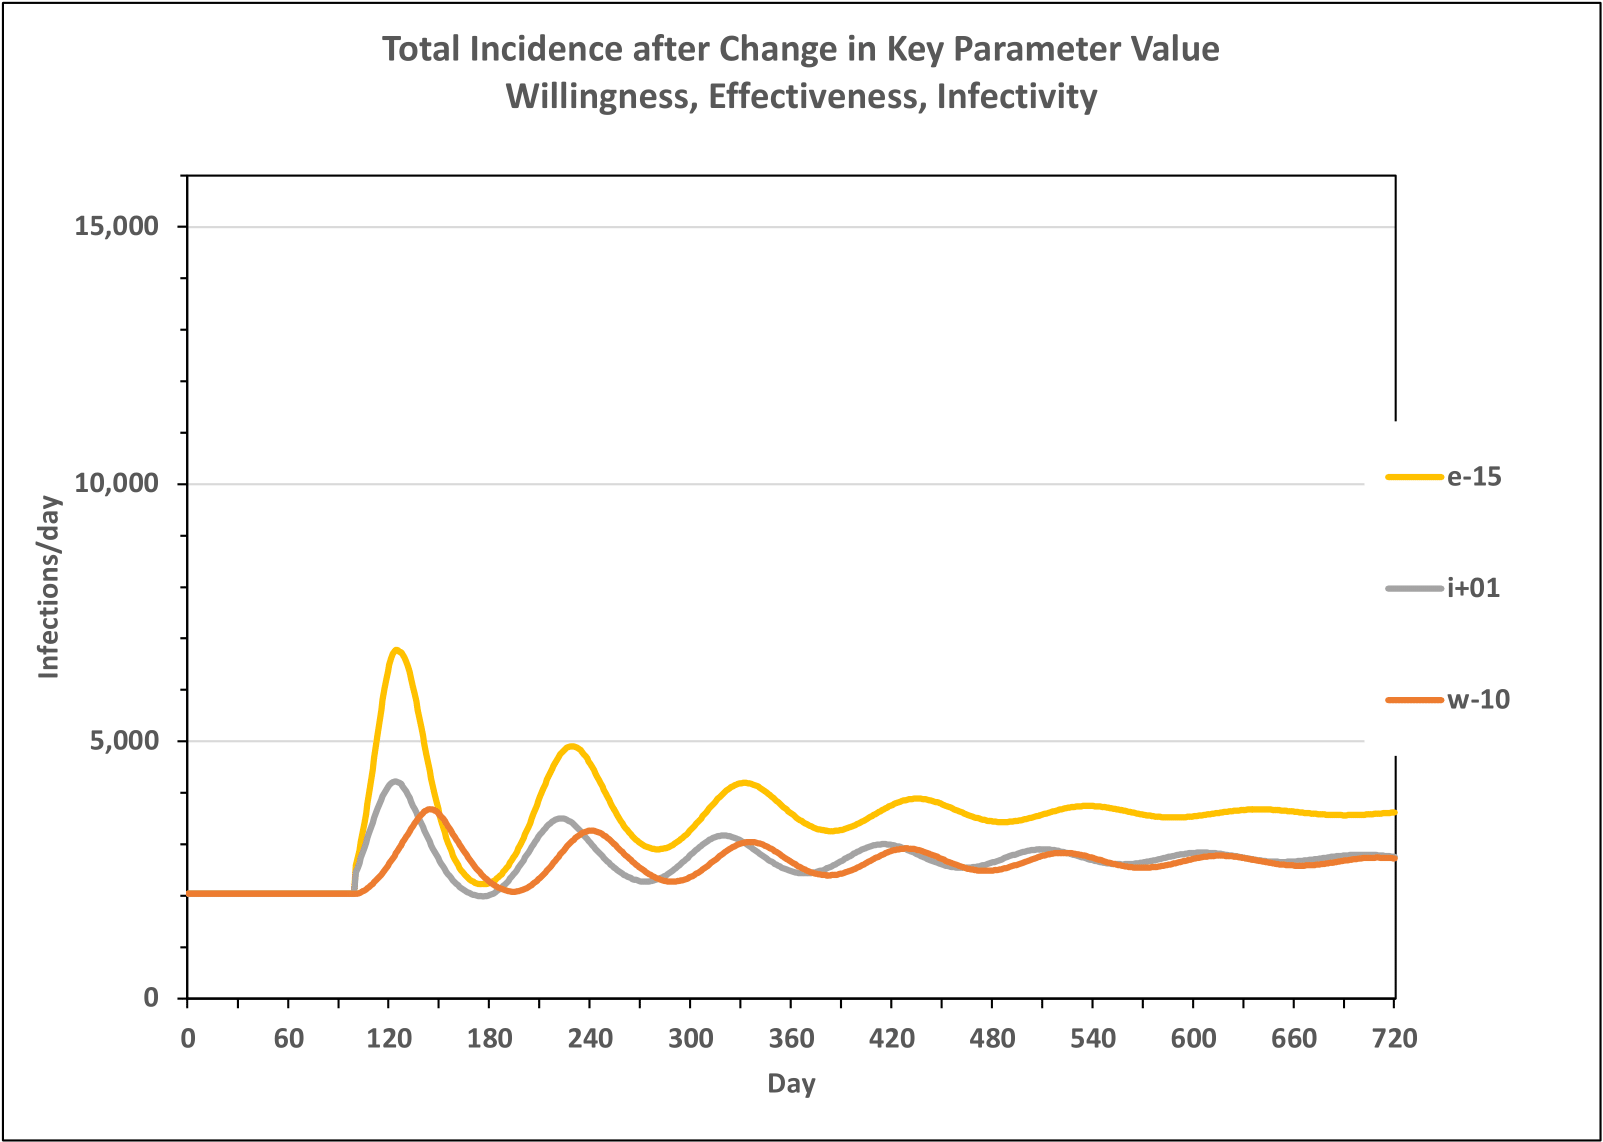
The orange line in Figure 2 shows what happens when Willingness to be Vaccinated suddenly decreases from 70% to 60%. This change sets off a series of small surges of decreasing amplitude and eventually resettles into a new, slightly higher, endemic equilibrium. The grey line shows a similar response when the model parameter “Infectivity” is suddenly increased by 20%. This parameter change might model the sudden emergence of a slightly more contagious variant. (By contrast, the Delta and Omicron have increased infectivity by more than 100%.) Finally, the yellow line shows what happens in the model when the effectiveness of the vaccine decreases from 90% to 75%. Of all the changes shown, this happens to have the largest impact, both in terms of the amplitude of the initial surge and the increase in the final equilibrium level. Overall, however, the pattern for all three of these relatively small changes is the same.
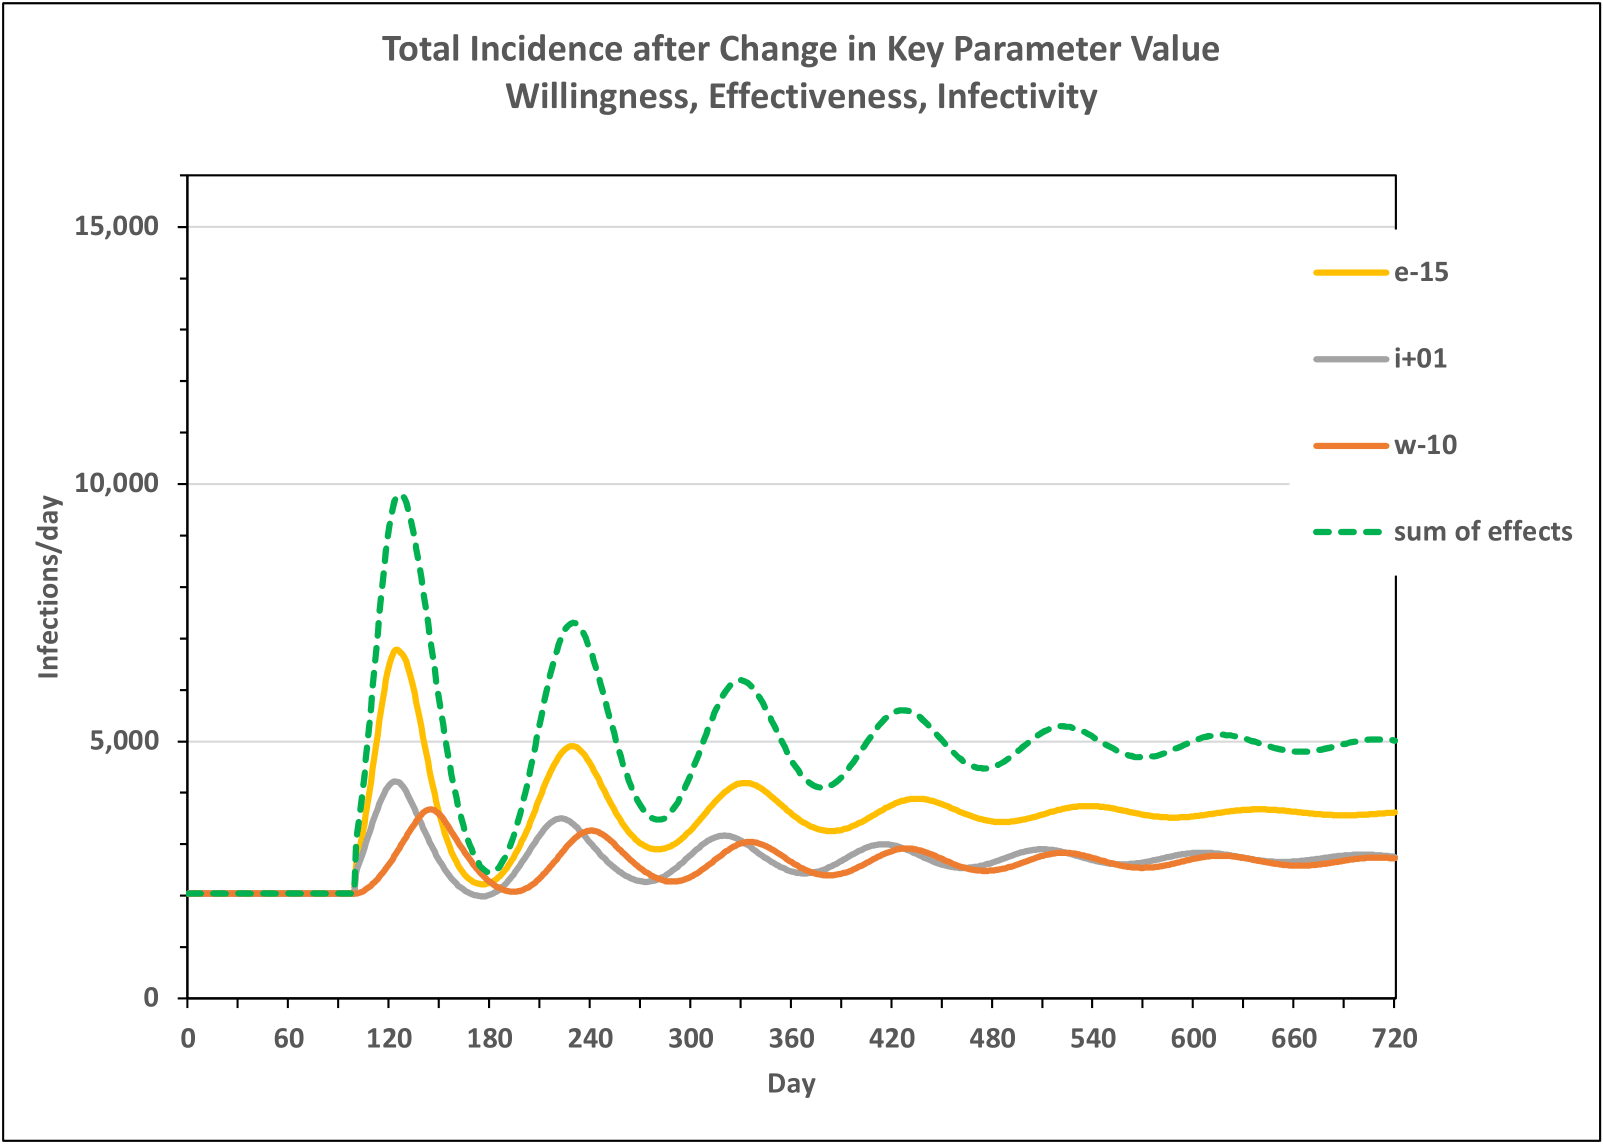
Figure 3 adds fourth curve, the dashed green line, that represents what we might naively expect if all three changes were implemented together. This new curve is the simple sum of all three effects, computed by adding the increased infections per day (above the initial baseline value) that arise from each individual change. This sum of effects, like the three curves below it, returns to a new equilibrium (albeit a somewhat higher one) after several surges of decreasing amplitude.
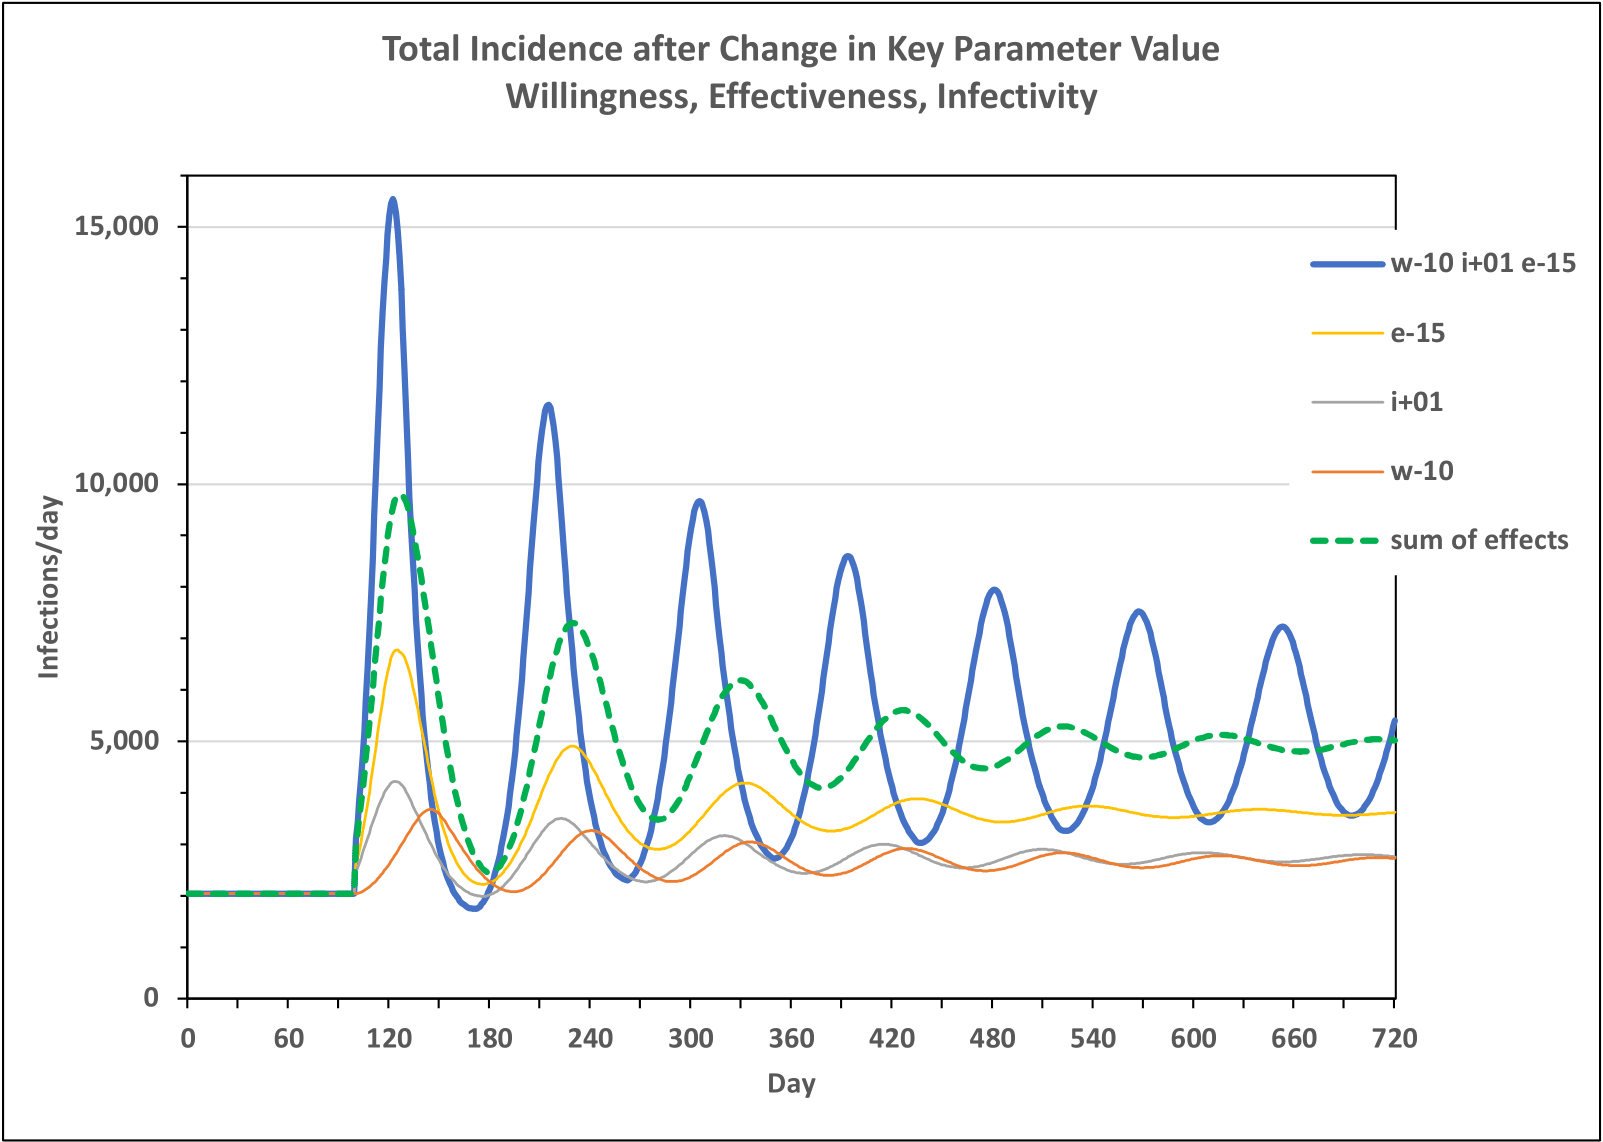
Figure 4 adds a fifth line (solid blue) that shows what happens when the three small changes are implemented together within one run. The results are dramatically different from the “sum of effects” run. When the three small changes in willingness, infectivity and vaccine effectiveness are implemented at the same time, the oscillations are much greater and the overall system does not return to a stable equilibrium in the span of 720 days. The system seems to be reverting to its original (i.e. no vaccine) behavior of self-sustaining surges caused by the interactions between viral infectivity and human countermeasures.
Figure 4 clearly illustrates the aphorism, “The whole is greater than the sum of its parts.” The three small “shoves” combine to push the system over a mathematical “tipping point,” causing the original, endogenous dynamics to re-emerge.