
Our regular pastor is on an extended family medical leave to support her brother in Oregon. For the last two weeks a member of our congregation, who also happens to hold his PhD in early church history, has served as supply pastor. His sermons have featured stories from the Old Testament prophets, Micha and Habakkuk. Set against the Assyrian invasion and destruction of the Northern Kingdom of Israel as well as Judah’s Babylonian exile coupled with the first destruction of the Temple in Jerusalem, these grim stories, in the end, turn into prophecies of social justice and hope.
I mention these sermons because this is the 50th story about the COVID pandemic to emerge from New Fadum Farm and now seems to be a good time to look back at the big picture of the story emerging from Ali’s model. Today, Ali’s model seems to be telling a story of almost Biblical proportions. There are three distinct phases to this story. First, a pandemic grows from a single viral infection in Wuhan, China, infecting the whole world in repeating surges that cannot be contained. Second, a vaccine is developed that seems capable of controlling the pandemic in the United States where the vaccine is available to all, but not fully used by all. Even as the repeating surges are being tamped down, in the third phase of this epic, a new variant—the Delta variant—emerges. In Ali’s model, the global pattern of surges repeating into the indefinite future reemerges.
Ali’s model can be run in a “what if” mode to show what would happen in the absence of human countermeasures to control the pandemic. The results would be devastating. Nature has its own cruel way of stopping the COVID pandemic—herd immunity, achieved the hard way. In just the United States, the pandemic would sweep unchecked through the human population infecting around 300 million people, putting around 30 million in need of hospitalization and bringing death to about 1% of the population (around 3 million persons). In the model, as in the real world, humans respond with a range of countermeasures before nature has a chance to take its course. In the real world these countermeasures include social distancing, wearing masks, contact tracing, voluntary testing, quarantines, mandatory lockdowns if things get bad enough, and in the end developing and administering a vaccine.
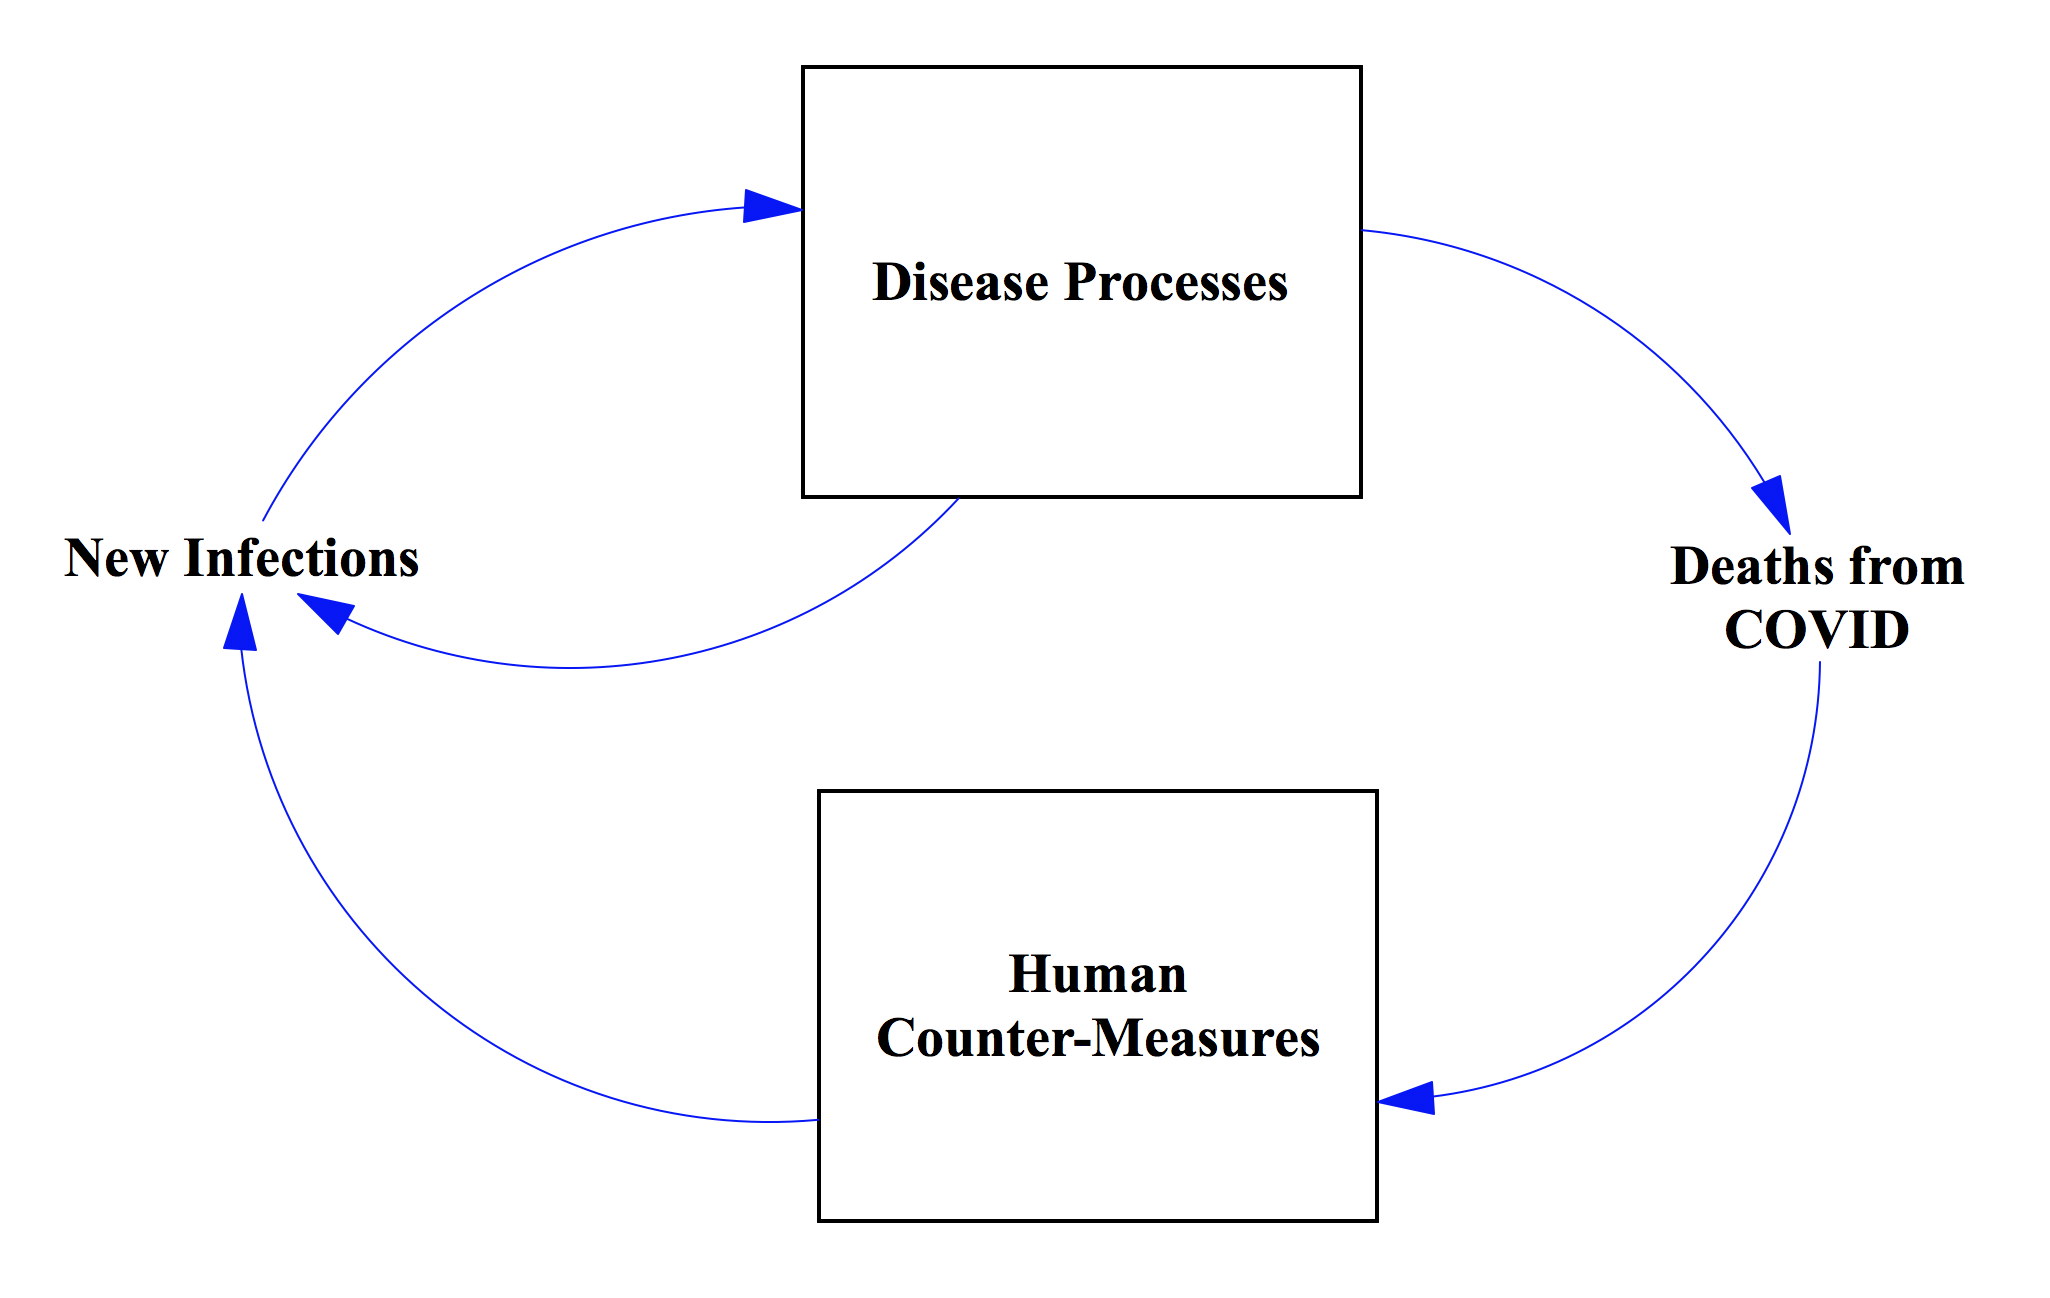
At a very high level of abstraction, in its first phase, Ali’s model can be thought of as a large feedback process that drives recurring surges to create the first great phase of this pandemic (Figure 2). When the infection rate gets bad enough, there are enough deaths to promote increasingly stringent countermeasures (of all sorts). These measures can and do hold down the infection, so deaths recede. As human countermeasures relax, an ever aggressive and opportunistic virus sets off a new round of disease. In Ali’s model, this process will continue until we reach herd immunity, which occurs when somewhere between 70% and 90% of the population become infected or vaccinated, whichever comes first.
The second phase of this story begins when a 90% effective vaccine becomes available and 70% of the population is willing to take it. Inside Ali’s model, these conditions create a mathematical “tipping point” wherein the whole system shifts from a mode of recurring cycles of explosive growth and decline to a stable mode with a much lower infection rate that is constant, more or less. The cycles of infection damp down. The crisis of the pandemic passes, though infections continue at a low level.
What happened next in the real world was that a mutation of the original COVID-19 virus began to spread, setting off the third phase in this epic story. Ali and Dan approximated the arrival of the Delta variant by changing the mathematical properties of the disease within the model. Vaccine effectiveness was dropped from 90% to 80% and, in line with observed epidemiological data, the infectivity of the virus doubled. The model tipped from a stable mode back to the original mode of oscillations driven by exponential growth on the upswings. This is more than just breakthrough infections among a small number of vaccinated persons. The whole system becomes re-engaged in surges because having 70% of the population protected by vaccines that are 80 % effective doesn’t lead to enough herd immunity to keep the whole pandemic system on the safe side of the mathematical tipping point.
Micha and Habakkuk did not have access to mathematical models and computer simulation. Epidemiological science coupled with a deep knowledge of virology and disease transmission was still two and a half millennia into the future. They would have ascribed the various phases in Ali’s model to divine intervention—massive, larger-than-life (literally), whole-system forces at work. We in the 21st century we have much greater science-based understanding of disease dynamics as well as a behavioral and epidemiological understanding of human countermeasures.
But Micha and Habakkuk did get the part about social justice and hope quite right. As we slip into the third phase of the Delta variant, we need Habakkuk’s message of hope. We need Micha’s sense of social justice to remind us that we are in this together and that none of us are over this pandemic until all of us are. Finally, we urgently need Micha’s and Habakkuk’s willingness to call out the false prophets among us who, for whatever reason, want to lead us away from a clear-headed science and fact-based view of pandemic dynamics.
Hope tells us there is a way out. Justice reminds us that we must work together, not trying to save ourselves while leaving the rest of the world to their own devices. Science, data, and models such as Ali’s that can tie the pieces together into a larger whole-system view give us a clearer vision of what needs to be done next.
This Story Has a Lesson
Looking back over more than a year working with Ali’s model, a sweeping epic of a three-phase epidemic comes into focus. In the first phase, repeating surges driven by at first more vigilant and subsequently less vigilant human countermeasures were destined to keep the pandemic oscillating forward in our future for a very long time. In the second phase, a 90% effective vaccine taken willingly by 70% of the population was sufficient to push the whole system over a “tipping point” where a stable and low level of background infection replaced on-going explosive surges. In the third phase, the emergence of the Delta variant pushed the system back over the tipping point and out of the safe range. A new version of the pandemic is upon us. Good science, accurate data and insightful models are tremendously helpful, but on their own they are not enough to get us safely out. We also need a moral vision that gives us the hope and tenacity to do what needs to be done next. We need a moral vision that promotes a sense of social justice and caring for our fellow global citizens. None of us can be safe until all of us are safe.
Read More to Dig Deeper
Since this is the 50th “Diary During (or After) the Lockdown” story, this technical note is longer. This note looks back to describe a bit more of the detail in Ali’s model. The model contains equations that describe both disease dynamics and human countermeasures. We need to take both types of causes into account to fully describe the dynamics of the pandemic.
The disease dynamics part of the model builds on standard epidemiological theory of how infections spread in human populations. Referred to as SEIR models, they divide the population into discrete compartments such as Susceptible, Exposed, Infected, and Recovered. Knowing specific biological parameters for a given disease is the key to developing these biology-based models. Important parameters would be factors such as average duration of infection, average duration of immunity post recovery, the average number of contacts per day of one susceptible person with other infected persons, and the probability of transmission per contact.
SEIR models capitalize on the fact that important biological forces are connected in feedback loops. For example, the number of daily infections accumulate to create a stock of infected persons. In turn, the number of infected persons on any given day drives a computation of the number of contacts between infected and susceptible persons, which in turn leads back to the daily number of infections in the next day, completing the loop. Circular computations in Ali’s model mimic the circular causation of disease in the real world.
Importantly, the model also contains equations that mimic human countermeasures such as decreasing daily contacts (aka, social distancing), decreasing the probability of contagion (mask wearing), testing and quarantine protocols, government mandates, reallocating hospital capacity, and most importantly, vaccination programs of varying effectiveness with varying participation rates.
Ali has created a short ten-minute video that describes how all these effects have been layered into his model. You can view that video at the following URL: Technical Details for Ali’s model. Similarly, Dan has created a video that discusses how all the disease and countermeasures represented in Ali’s model combine over time to create a simulated trajectory for one key variable—number of persons infected daily by the pandemic. You can view Dan’s video at the following URL: Behavior of Total Infected in Ali’s model. If you are both curious and motivated enough to dive into all the details, Hyunjung has created a curriculum consisting of several modules that can help you do just that. Completing these modules could take hours of time and effort (and could even earn you 3 college credits 😊). You can view her video at the following URL: Building a System Dynamics Curriculum Based on Ali’s Model.
Ali’s model is not intended to predict the magnitude or timing of the pandemic in any particular region. While some of the base numbers were calibrated to reflect a whole nation the size of Iran, the purpose of the model is to describe and help us understand interactions between disease dynamics and human countermeasures in any region (such as Upstate New York around New Fadum Farm). Hence, his model is a mathematical abstraction that leaves out some important factors: it doesn’t break out the population by gender or age group; there are no social networks in our populations; there are no winter or summer seasons in this model; schools do not come into session in the fall or release for summer breaks 1. Time in this model doesn’t correspond to any particular calendar dates. Rather it just starts at an arbitrary day zero – the day of the first infection.
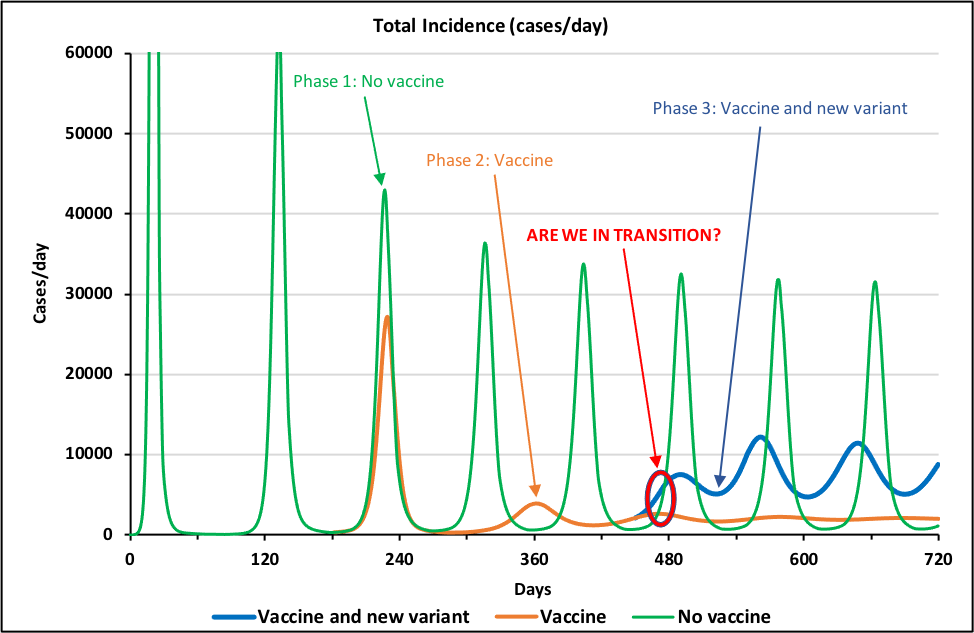
Phase 1: Original COVID-19 pandemic. All three phases of the pandemic show identical dynamics for the first 200 days and hence the green, brown, and blue lines print out on top of each other, looking like a single green line. The first scenario (“No vaccine” – green line in Figure 3) shows what would happen if there were no vaccines and no Delta variant. The line shows that the pandemic has a distinctive pattern of recurring surges that are spaced about 4 months apart. The surges occur because of the continuing interactions between disease dynamics and human countermeasures. In the model, as deaths rise above some threshold, the human population becomes cautious and implements an array of countermeasures. When these succeed in reducing the infection rate, the population relaxes its vigilance. The virus, however, is still present in the population, so a new wave of infections commences.
Ali’s model does not allow for any long-term learning by the human population, so surges continue on and on, easily for a decade or more. Looking a human behavior over the first two years of the real-world pandemic, we might indeed conclude that, alas, the assumption of no long-term learning is not all that unrealistic.
Phase 2: 70% Willingness to Vaccinate Suppresses Original Pandemic. All the dynamics of the repeating surges in the green line in Figure 3 are created within (or endogenous to) the interactions of disease dynamics and human countermeasures. At day 180, the vaccine roll-out begins. The roll-out is external to (or exogenous from) the internal dynamics of the pandemic; in other words, we – the modelers – specify before the run even starts that it will start at that time. The brown curve (“Vaccine”) in Figure 3 shows the results of a vaccine that is 90% effective, with 70% of the population willing to take it. It takes about 3 cycles to damp out the surges, but by day 720 the pandemic has flattened out to a stable infection rate that no longer surges. At that point the population is on the edge of herd immunity.
Phase 3: Delta Variant Recreates Original Pattern of Recurring Surges. The second external force that Dan and Ali have inserted into the model is the emergence of a new variant of the virus, similar to the Delta variant. They changed the model so that between days 450 and 550, vaccine effectiveness declines from 90% to 80% and the relative infectiousness of the virus doubles. Changing these two parameters shifts model away from herd immunity. The result is that infections, which had been moving toward a stable, low level, start oscillating again (“Vaccine and new variant” – blue line in Figure 3.) Interestingly, the oscillations of the blue line are as persistent as those in the green line. Furthermore, even though the green line’s oscillations are larger than the blue line’s and its peaks are higher, its troughs are lower, so that the total number of persons infected in each wave (i.e., the area under the curve) is about the same in the blue and green curves. Does that mean that the vaccination program has failed with regard to the new variant? Not at all – without 70% of the population being vaccinated with an 80% effective vaccine the toll from the new variant would be much, much higher.
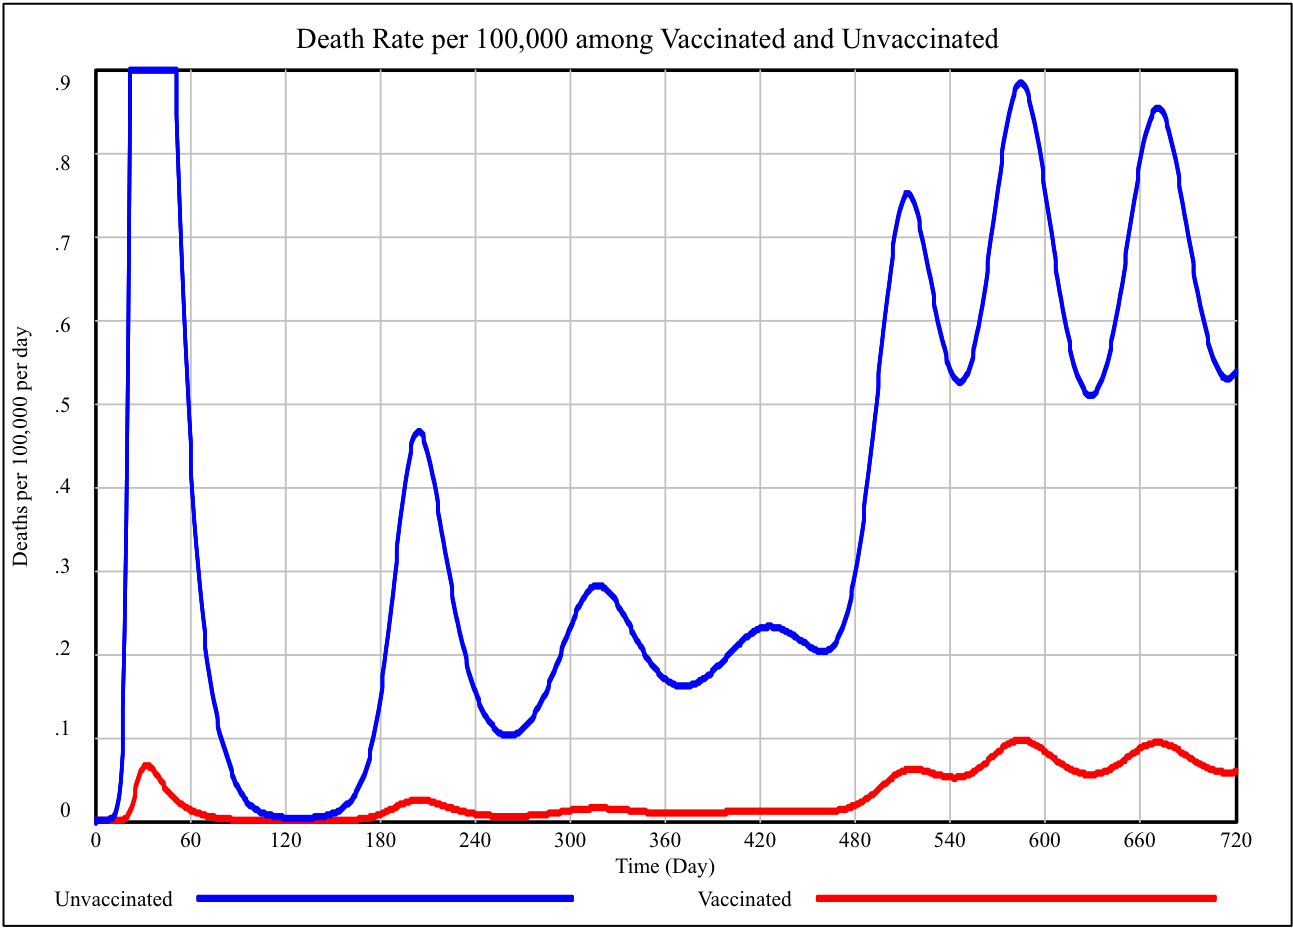
Fortunately for vaccinated persons, the surges occur mostly within the 30% of the population that is unvaccinated. Figure 4 illustrates this effect. The blue line is the death rate per 100,000 for unvaccinated persons over the same 720-day simulation. The red line shows the rate for vaccinated persons. (Obviously, before anyone is vaccinated, this rate is zero.) There are still serious illness and deaths among the vaccinated, but the rate is much lower than among the unvaccinated.
In Figure 3 there is a red donut, “0”, around the blue and brown lines at about day 480. To a person living in Ali’s model world, 480 days into the pandemic would be a confusing time. The vaccines started to come in at day 180 and the shift to the new variant began at day 450. So, the uptick in infections seen at day 480 could be a final not-yet-damped-out surge left over from the original green-line infection as the vaccinations are taking effect, or it could be the beginning of a new phase in the epidemic. In the first case, all the surges would be dying out. In the second case, the surges are coming back strong for a much longer term. We live outside the simulation world, so we know the answer—the surges are coming back strong for a much longer term. Of course we know precisely all the “what if” conditions. Knowing all the facts is not so easy in the real world.
By the way, it has been one year and six months since we started to write these stories. That is 480 days2.
Lastly, this 50th story out of the “Diaries During (and After) Lockdown” project is not just about a technical model and its results. It also includes an important digression about Micha and Habakkuk. What’s that all about? Here at New Fadum Farm, we believe that making sense of the pandemic requires solid data and good science, but it also requires a moral compass. Knowing how to behave in these times doesn’t emerge just from data and science. We could understand the science perfectly well and use it just for our own benefit, ignoring our community.
Our team here at the New Fadum Farm project derives our individual and moral compass from a mix, different for each one of us, of our individual religions and from secular ethical reasoning about social justice. This is important stuff. Some of our stories are set in the context of decisions that needed to be made by church members. We emphasize that the same considerations arise in our decisions about scout troops, little league, 4-H clubs, or family gatherings.
Viewing decisions about how to conduct ourselves through a lens of what seems best for ourselves individually (such as asserting that the decision to get vaccinated is a purely a matter of “personal choice”) will not work in this time of pandemic. Correct decision-making requires a moral and ethical compass that includes concern for the many. No one can truly be fully safe until all of us are. We believe this is both a scientifically and a moral truth.
Footnotes
- These more generic models, such as Ali’s model, stand in contrast to a class of models that are carefully calibrated against detailed time series data For one example of such a model of the COVID-19 pandemic calibrated to multiple time series for 92 countries, see: Rahmandad, H., Lim, TY., Sterman, J., “Behavioral Dynamics of COVID-19: Estimating Under-Reporting, Multiple Waves, and Adherence Fatigue Across 92 Nations”, System Dynamics Review, Forthcoming, Available at SSRN: https://ssrn.com/abstract=3635047 or http://dx.doi.org/10.2139/ssrn.3635047
- The timing of the uptick in infections at 480 days is controlled by the timing of the start of the vaccination program (day 180) and the timing of the onset of the Delta variant (between days 450 and 550). Both timing effects were modeler’s decisions based on our casual observations of how things are going here at New Fadum Farm, not independently and precisely measured events in the real world.