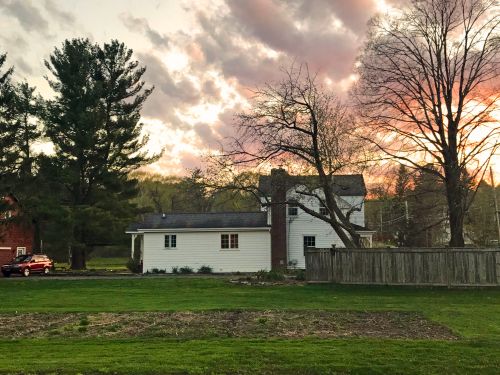
We live on a small 40 acre sheep farm in Upstate New York. When Deborah Retired several years ago from her teaching position at the university, she turned her attention to the fiber arts and this place supports those interest. Our three daughters grew up here. We count ourselves lucky because our granddaughters live here now. A few years ago we sold the old white farm house to our daughter and her husband and we moved into smaller quarters next door. We call this place “New Fadum Farm”, named after the original Fadum Farm in Norway where my grandfather was born. When Anders and Bjorg traveled from the original Fadum Farm in Norway to celebrate our daughter’s wedding with us it was a big deal. So you can imagine how eager we have been for a very long time to make a return trip with our daughter and her family to the original Fadum Farm in Norway. You can also easily imagine our disappointment and concern when the Corona virus threatened that trip, long ago scheduled for this summer. Norway had closed its borders. Would the planes be flying again and in time this summer?
Some version of this same story seems to be on everyone’s mind. When will things get back to normal? Most people’s concerns are much more serious than our trip planning. My brother has to meet payroll for his 40 employees—how long will it take for his firm’s income to recover? Our church has suspended face-to-face worship. When will we be able to gather together again? When will children return to school? This spring, over the summer, or next fall? Will our favorite restaurant survive? What happens to all of the people out of work? (This last question seems to be the two–or is it three or four?–trillion dollar question!)
Pundits may have opinions on this matter. The President of the United States may even have made a pronouncement or two. But for important questions like these, I always want to rely on people who are looking clearly at the data. This is where formal math-based simulation models, such as system dynamics models, help a lot. These models thrive on data. They are calibrated and tested against measured results in the real world. How many infections have occurred at what points in time? How many of these are being treated at home? In hospitals? What are the health outcomes for persons with pre-exiting health conditions? The more data the better.
Just as important, these models include scientifically established facts and theories that have been sorted out over many years of research. How do social contacts drive infection? How long do similar illnesses typically last? What impacts do asymptomatic carriers have on the overall rate of infection? Epidemiologists know a lot about these questions from scientific studies of previous epidemics and math-based models are a great way to assemble all of that data and knowledge to gain important insights.
Ali’s model does not seek to make point predictions. It seeks to depict the broad modes of behavior over time that may emerge from the COVID-19 pandemic. The major mode of behavior that Ali’s model showed was repeated rising and falling in the number of infections over time. That is, his model showed that after the first peak passes, there is a strong likelihood of a second wave or even a third wave. The shortest time horizon that he presented for understanding these dynamics was 360 days, implying that it would be at least one full year before the dynamics of the pandemic played itself out, and in worse scenarios, the time horizon could be twice that long. In fact, his simulations were predicated on the assumption that a vaccine does not yet exist and the time frame for continuing to have to deal with disruptions from the pandemic will extend out until such time as a good vaccine becomes available.
Sometimes models draw our attention to surprising facts and issues, which after some thought, are not really all that surprising. After all, the 1918 pandemic had several bounce backs and didn’t really resolve itself for several years. We’ve already seen small bounce backs in several Asian countries that seemed to have done such a good job controlling the first wave. Looking at Ali’s model convinced me that we had better cancel our airline tickets for the trip to Norway and look into making or trip at least one year or maybe even two years into the future.
This Story Has a Lesson
Formal simulation models help to organize the data and facts about a complex system into a synthesized whole that is easier to reliably make sense of. When our “mental models” are informed by such a formal math-based simulation model it is easier to make decisions about the future.
Read More to Dig Deeper
As I started to look at some data-based models, the first model that I found was created at the Institute for Health Metrics and Evaluation (IHME) at the University of Washington. The apparent purpose of this model was to forecast when the peak resource usage for COVID-19 patients would occur in various states and nations and then to compare peak demand to an estimate of supply for key these resources. For example, this model forecast a peak resource demand for New York state on April 8 (hey, that would be right about the time I am writing this story) with a shortage of ICU beds of 10,352 (the only resource that I am reporting out in this short story). A similar projection for the whole of the United States forecast a peak resource usage on April 11 with a shortage of 8,018 ICU beds. Norway was forecast to experience peak resource usage on April 23 with a national shortage of only 128 ICU beds. Because the purpose of this model was to focus on peak resource usage, it did not pay much attention to the length of the tail of the epidemic. But these numbers seemed to hold out some hope that we might be able to make the trip, perhaps very late in the summer.
The second model that I happened upon was a carefully calibrated simulation from Imperial College in London that was designed with a much different purpose. These researchers were trying to estimate the effectiveness, measured as the number of lives saved in twelve EU countries by a suite of “non pharmacological interventions” such as closing schools, shuttering businesses, maintaining social distance, and more severe ‘lock down” policies. There calibrated simulations ran through the end of March and estimated that the total number of lives saved by such non-medical interventions to be around 59,000 by the first of April. I felt better about doing my part by wearing my face mask to maintain social distance, but I did not get really good information about whether or not I would we able to travel to the original Fadum Farm in Norway this summer. After all, these well-calibrated simulation stopped by April 1.
The third model that I found was a “What-If” simulation of COVID-19 produced by ISEE systems. This simulator contained an elegant demonstration of four basic modes that might emerge from the COVID-19 pandemic: (1) Do Nothing, (2) Effective Quarantine, (3) Additional Testing, and (4) Containment. These four scenarios were calibrated for a hypothetical city, Anytown, of one million inhabitants. The model’s four base scenarios showed a wide range of possible behaviors. In the worst case (do nothing), the epidemic came to a peak within 100 to 120 days, with over 500,000 persons engaged with the epidemic at that peak and cumulative deaths at round 22,000 persons. In the best case (containment) by contrast, the epidemic came to a much shallower peak, engaging only around 80,000 persons at all levels of severity with only around 5,000 deaths. This shallow peak emerged much later, almost a full year into the epidemic. For each of the four scenarios, as a user I could play around with the many model parameters that drive severity and impact. That was, for me, very interesting. The relatively long time frame of this simulation model seemed to me to indicate that our trip to Norway surely could not happen this summer. Meanwhile, the medical community is racing to develop tests for infectivity and immunity, effective early treatment as well as effective late stage treatments not to mention continuing to focus on the ultimate prize of an effective vaccine. While we wait for these more permanent medical “fixes”, I would turn my attention to formal math-based models to search for interim pathways forward, creating a practical policy bridge between now and when we have a proven vaccine—the next 18 months (or more). I expect that we will be in this situation for quite a while.


